XMM-NEWTON · FORNAX CLUSTER · MOS1 + MOS2

Fornax
spectral atlas

An inspectable overview of 17 radial regions. Each spectrum comes from a saved independent SrcApec best fit, retaining one step best fit per data set, residuals, and a smooth total model.

SPECTRAL REGIONS

17all saved inspect products

FIT BAND

0.4–7.0keV · MOS only

INDEPENDENT y INPUTS

7non-overlapping primary annuli
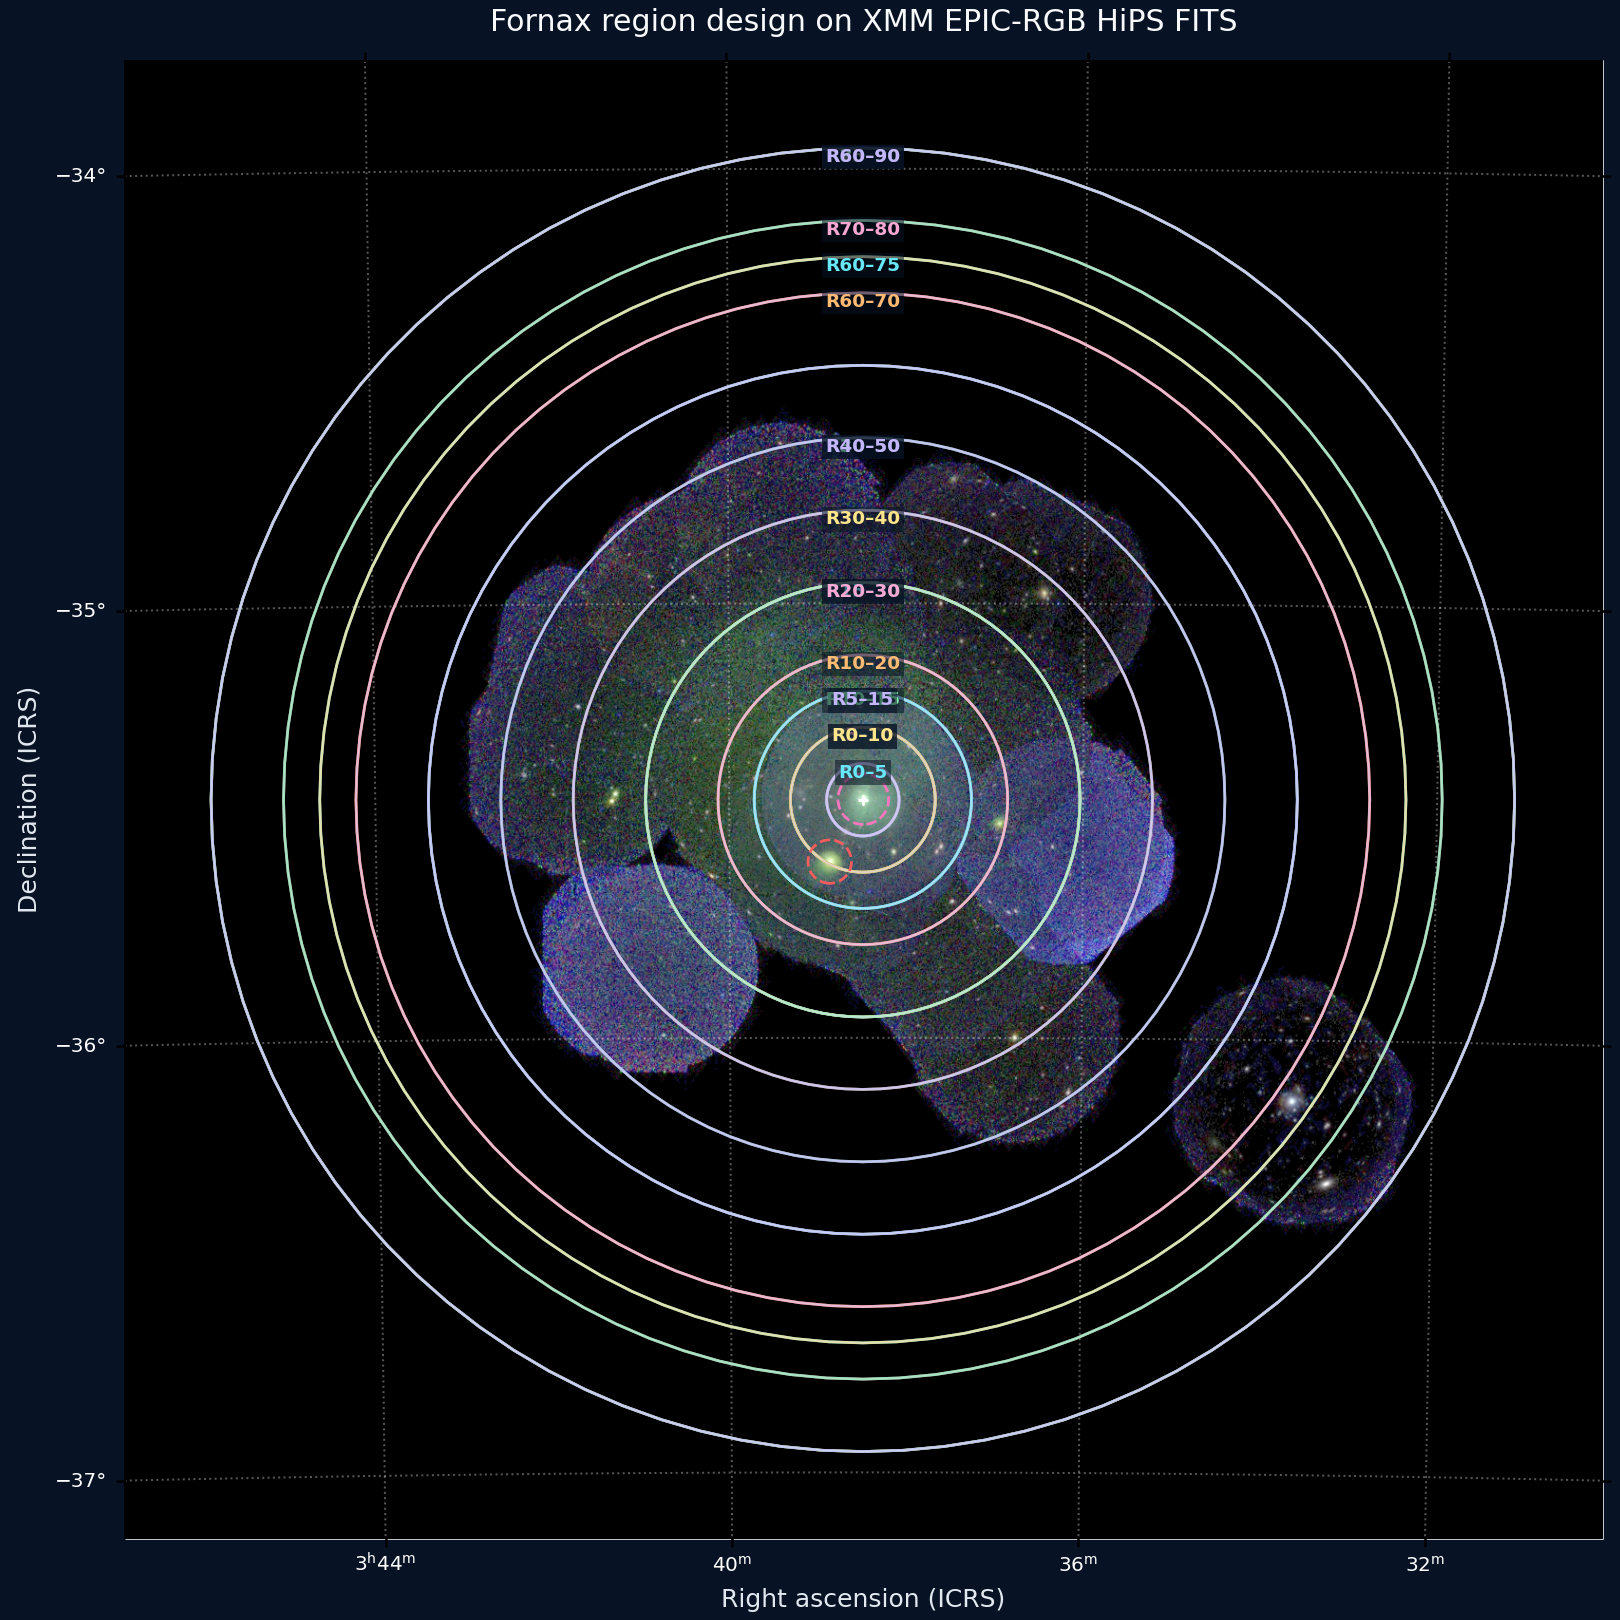
Fornax XMM EPIC RGB WCS image with all radial regions overlaid
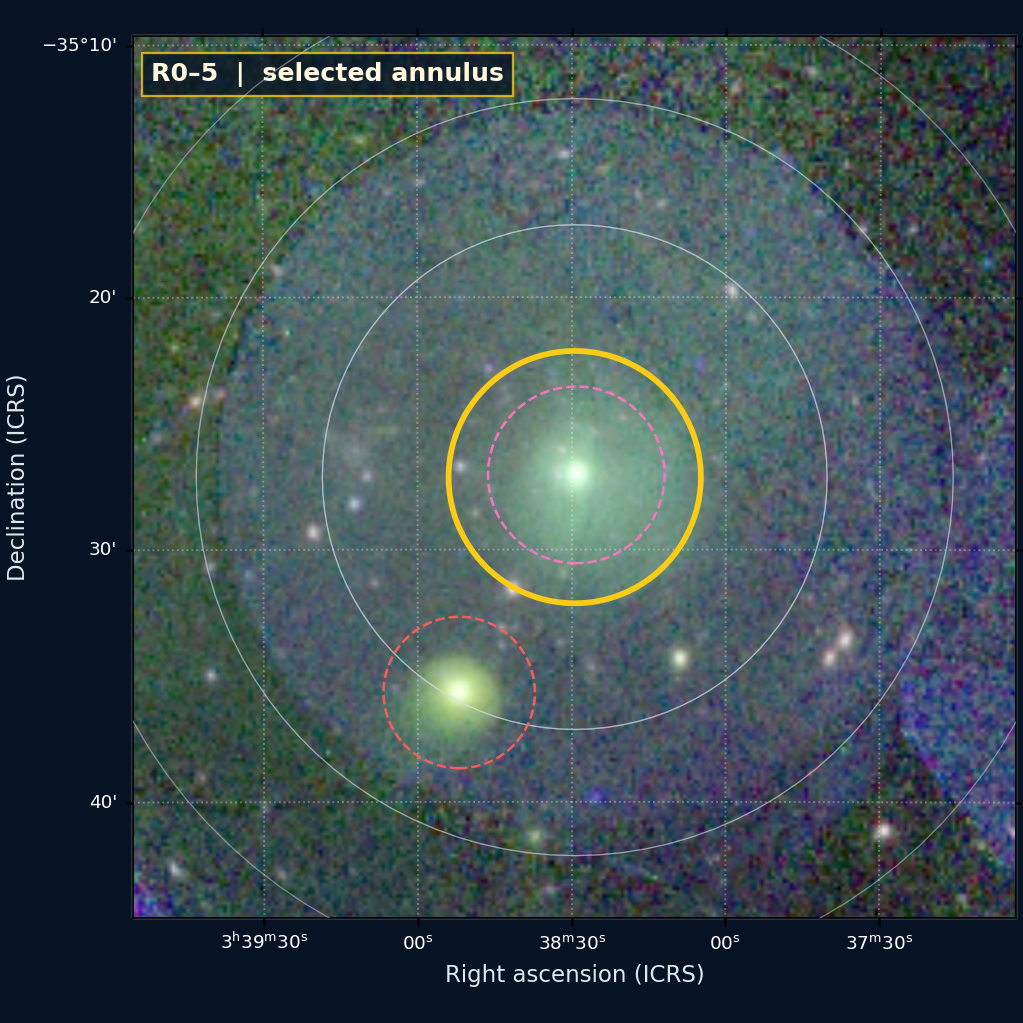
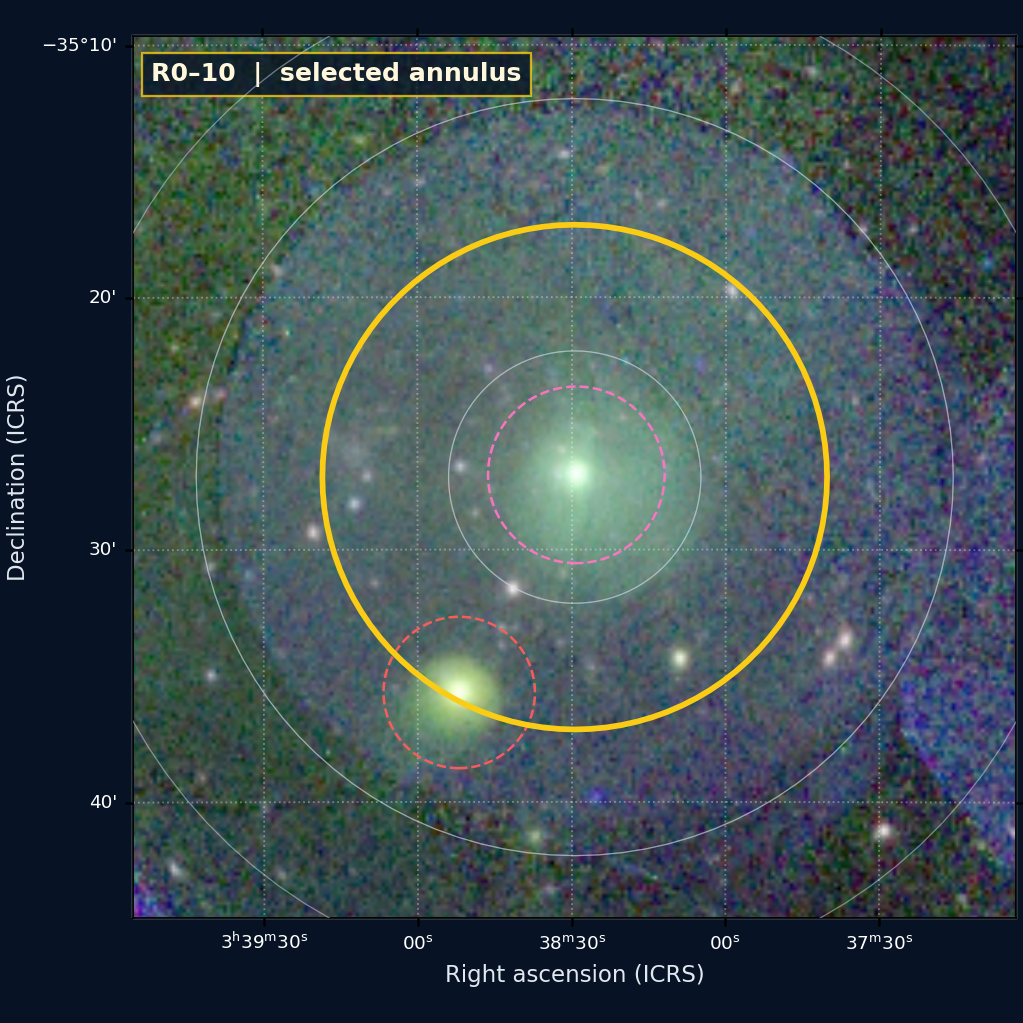
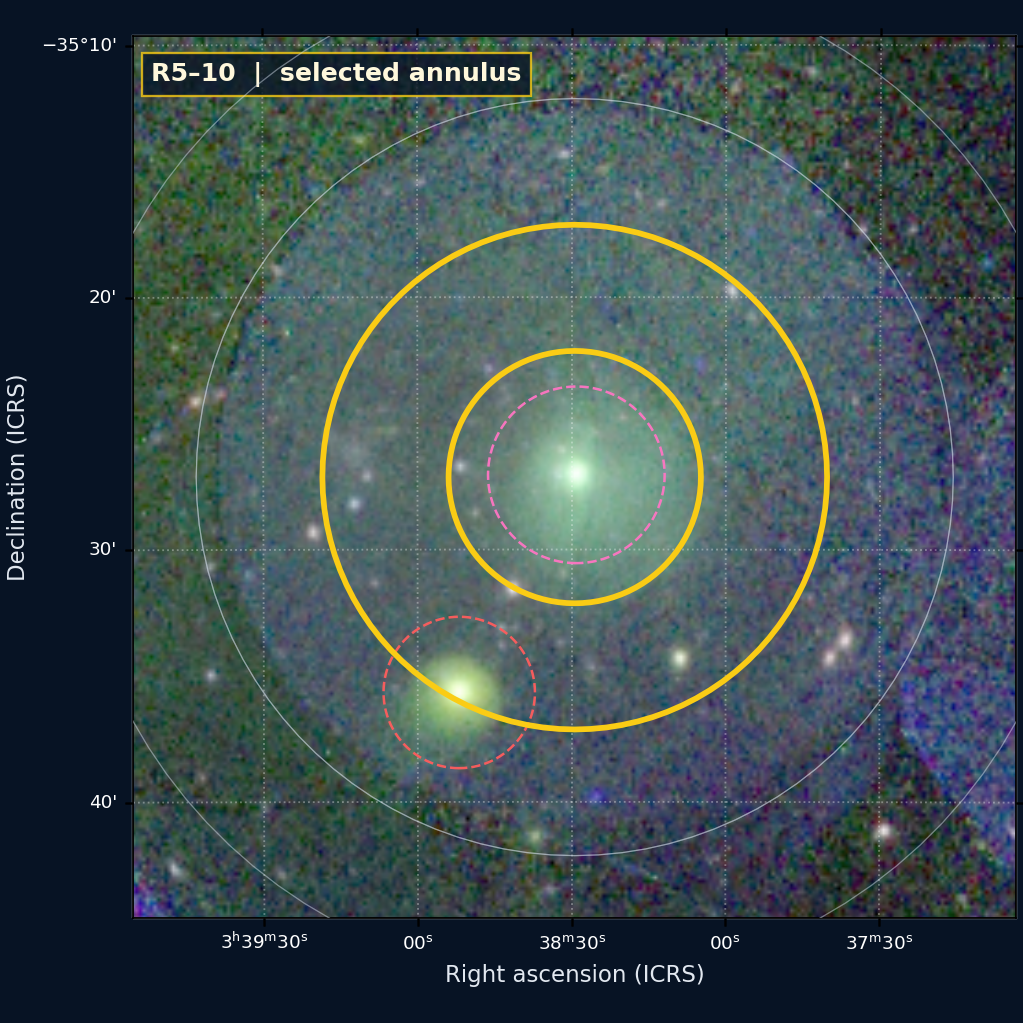
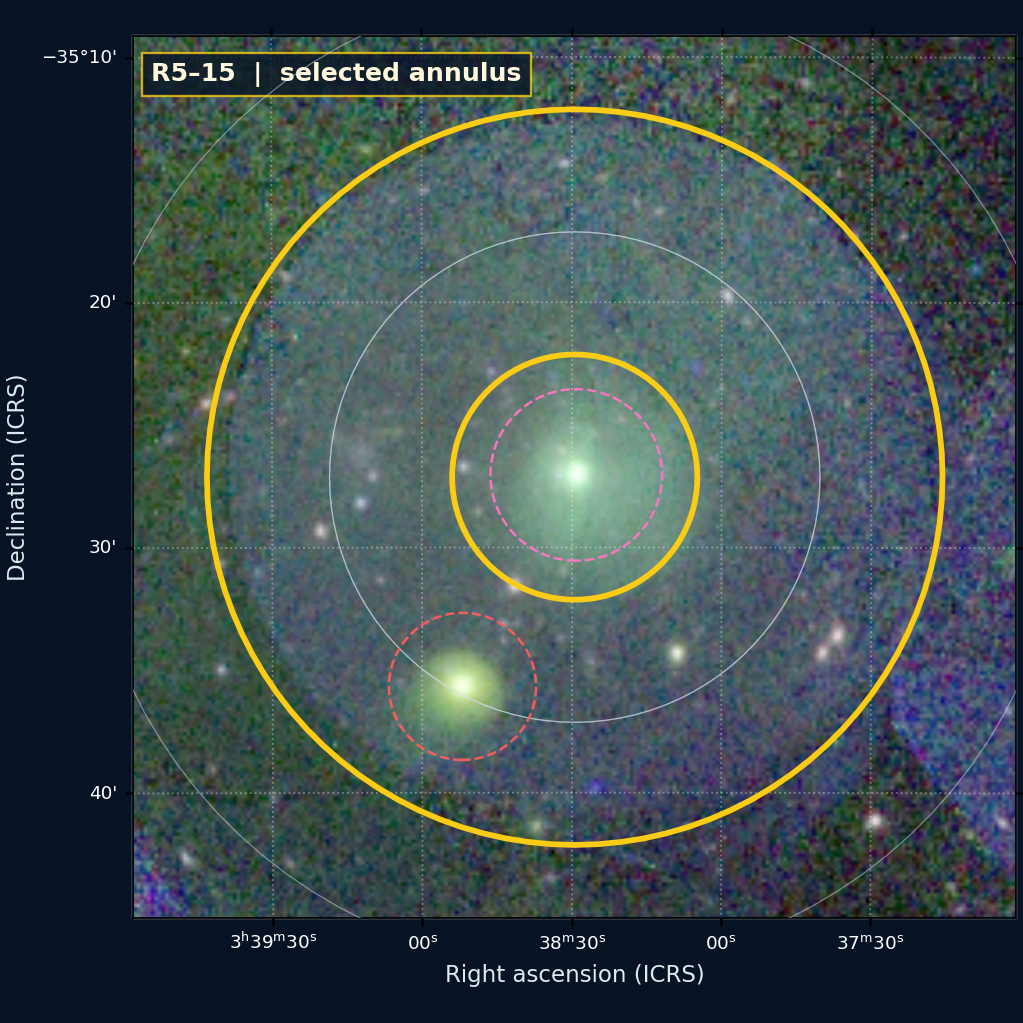
XMM EPIC-RGB HiPS FITS + Astropy WCS. Fine lines mark all analysis annuli; the pink dashed circle is the retained NGC 1399 centre and the red dashed circle excludes NGC 1404.

Current-analysis figures are derived from saved fit, inspection, or profile products; the literature panel uses only explicitly reported primary-paper values. This site neither reruns Sherpa fitting nor exposes PHA, response, or event files.

Important normalization correction · 2026-08-29

The earlier xsherpa port represented sky area as Const1D. Sherpa treats that term as energy-bin-width aware, adding ΔE≈0.005 and making the entire model about 200 times too faint. Every free normalization then grew by about 200, so relative agreement among ObsIDs, fitted count curves, and R-stat could all look good while the absolute EM, nₑ, y/Y scale was wrong. The current plots use the validated v18-style Python scalar sky-area multiplier and only corrected per-ObsID results.

01 · OVERVIEW

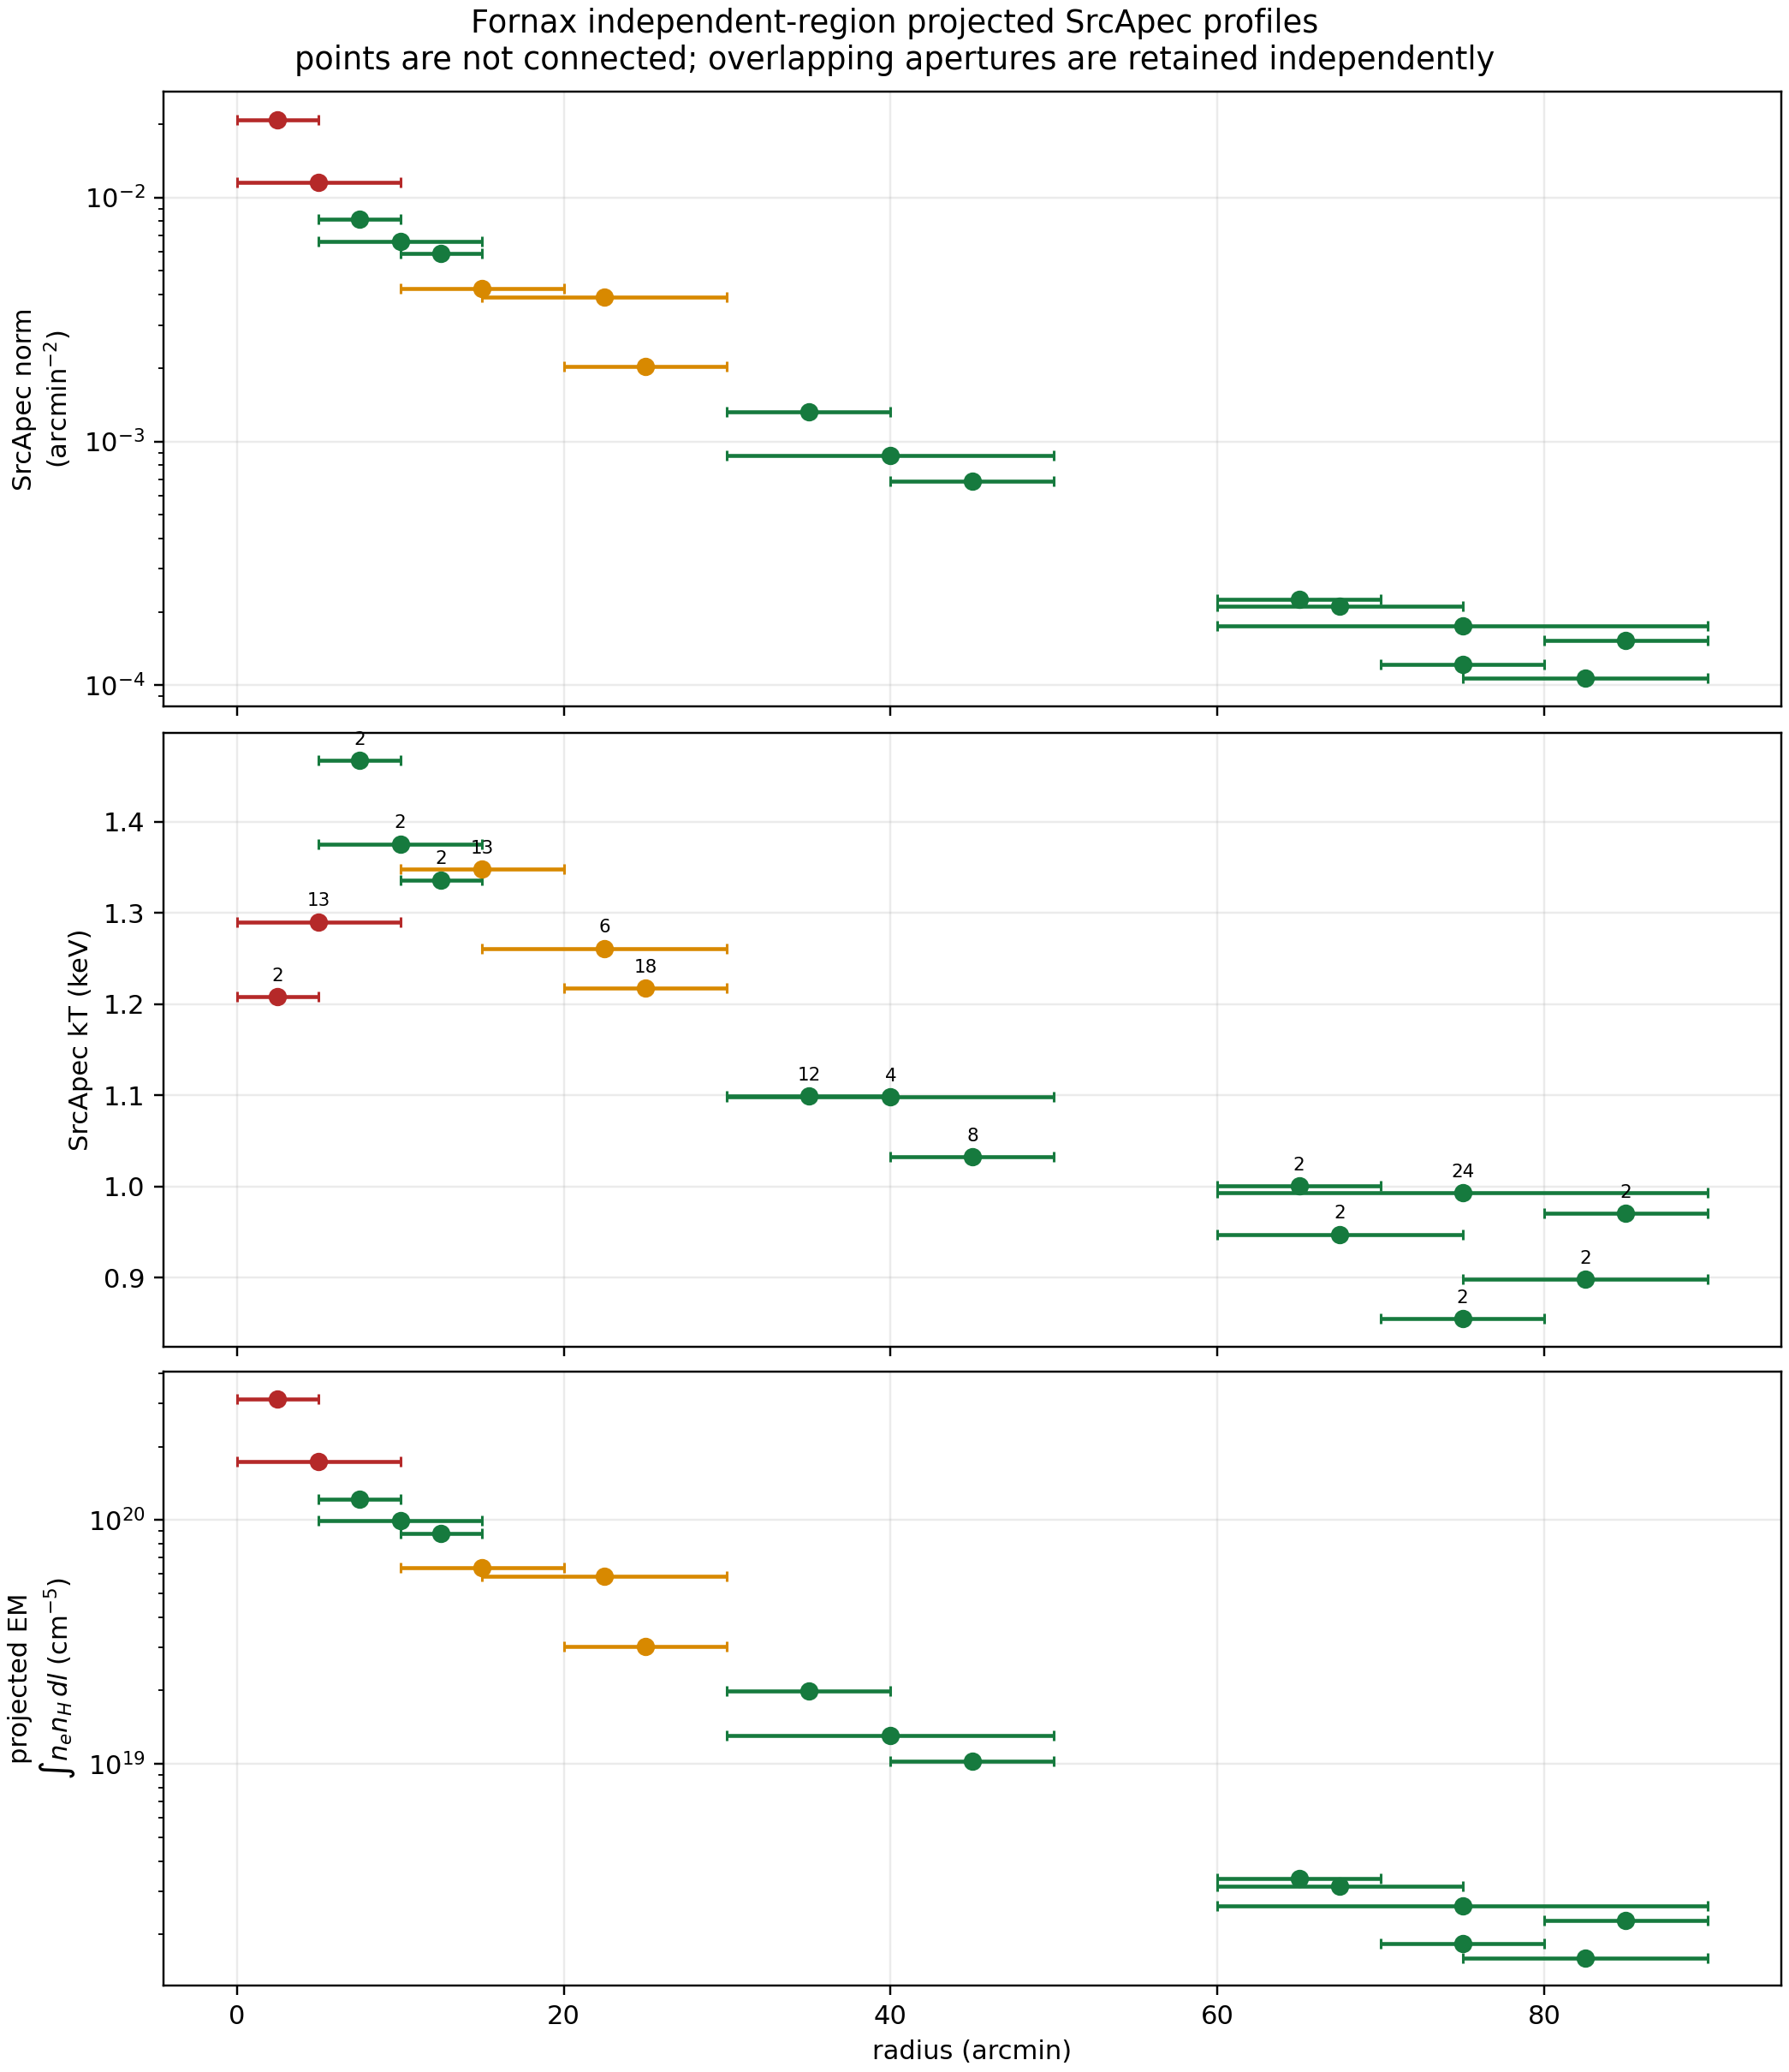
X-ray profiles

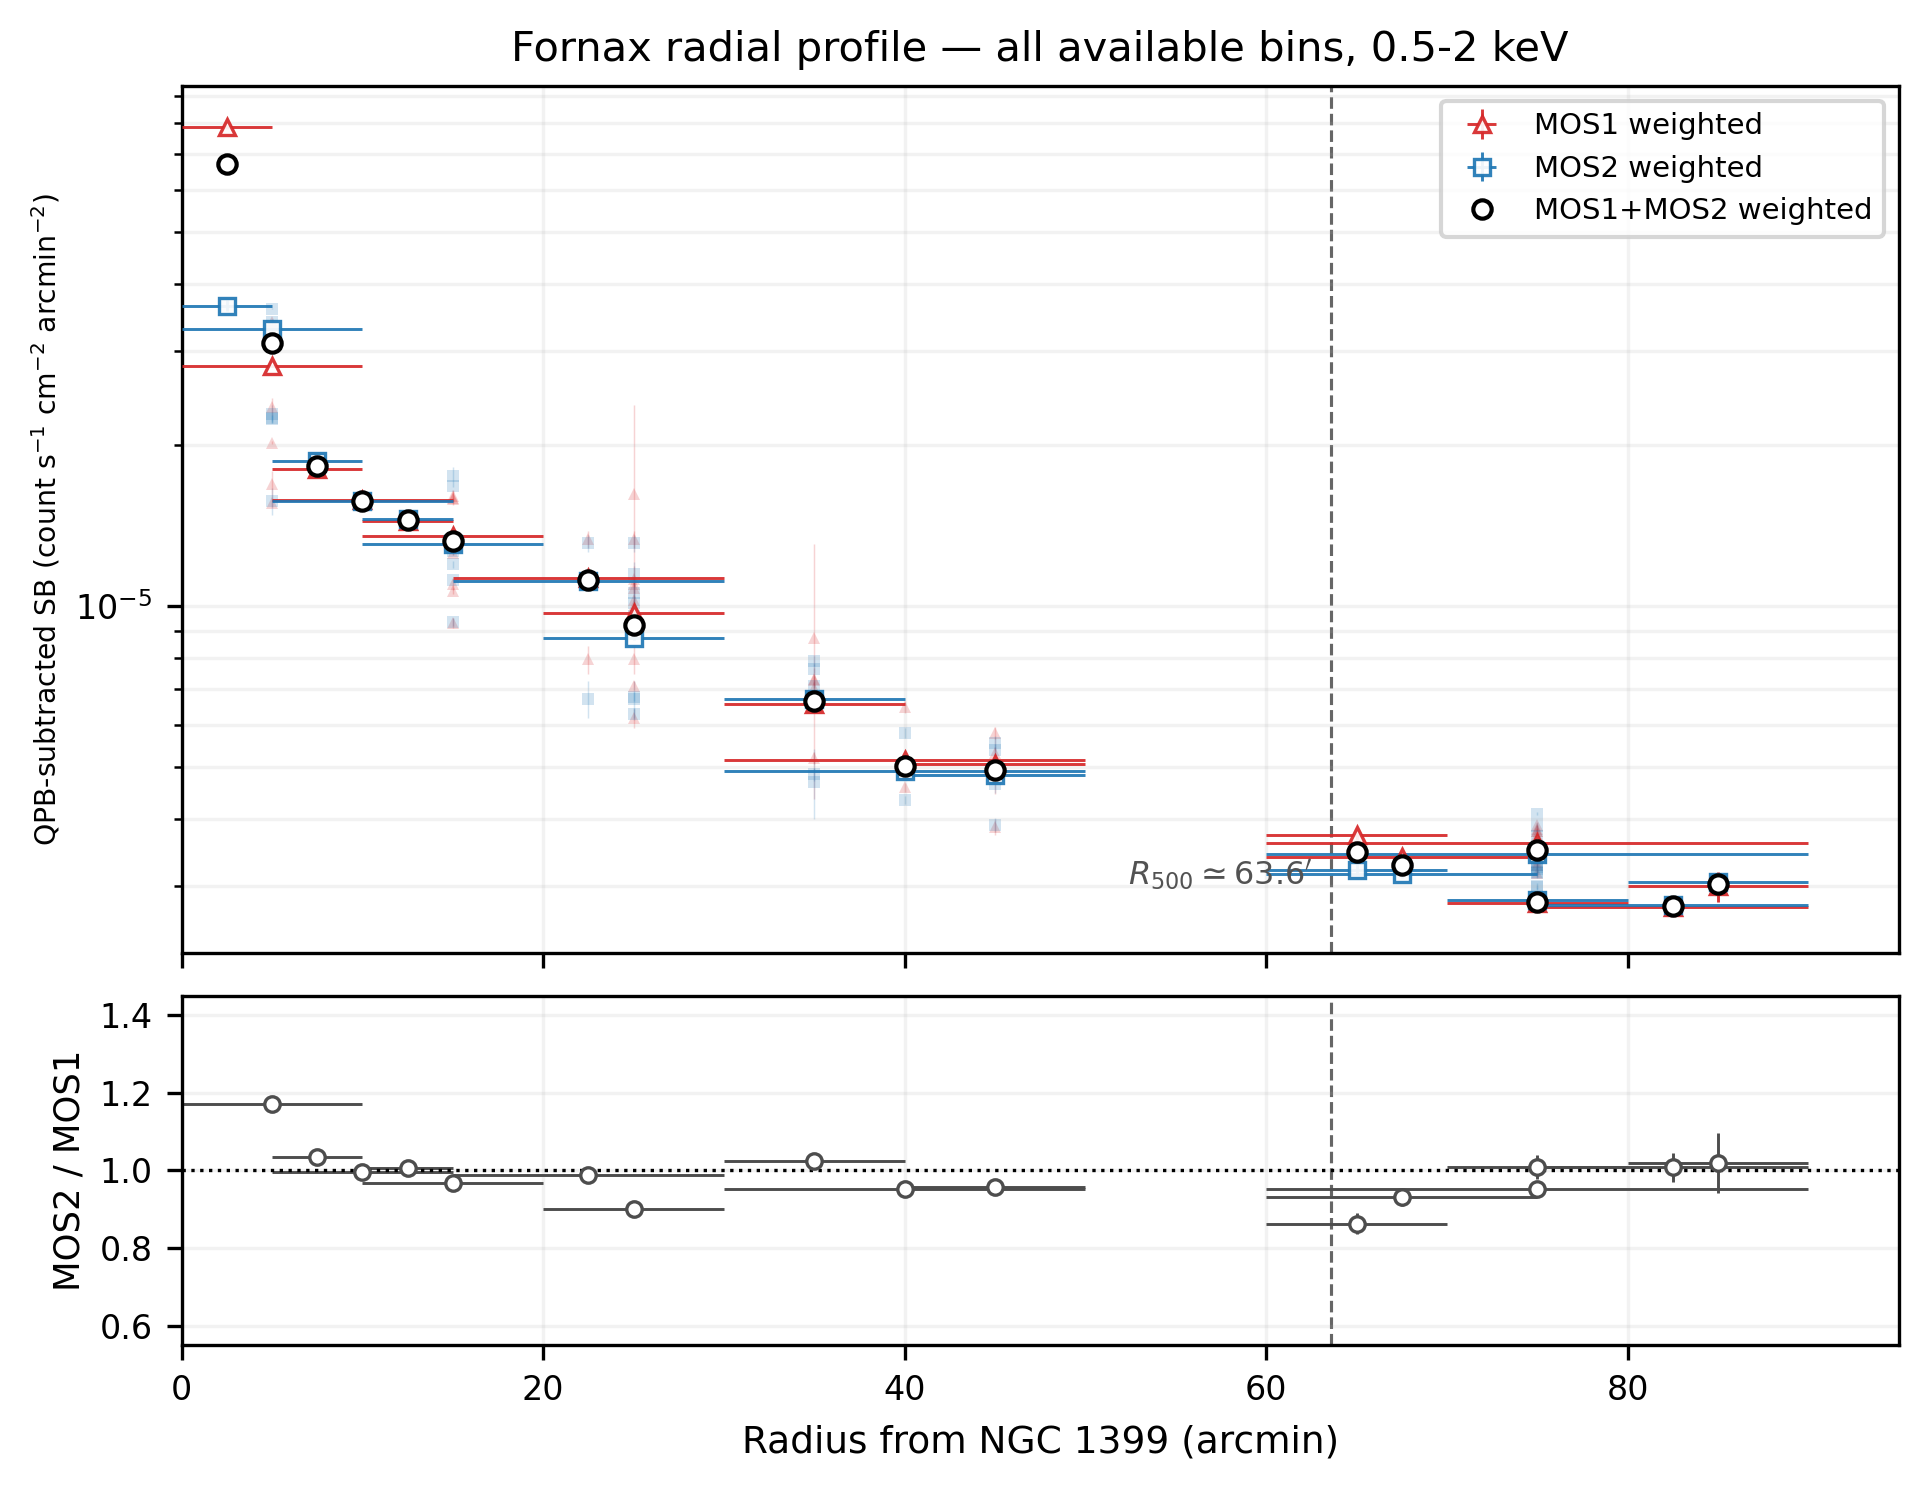
Overlapping regions are observational diagnostics; they do not automatically form independent three-dimensional shells.
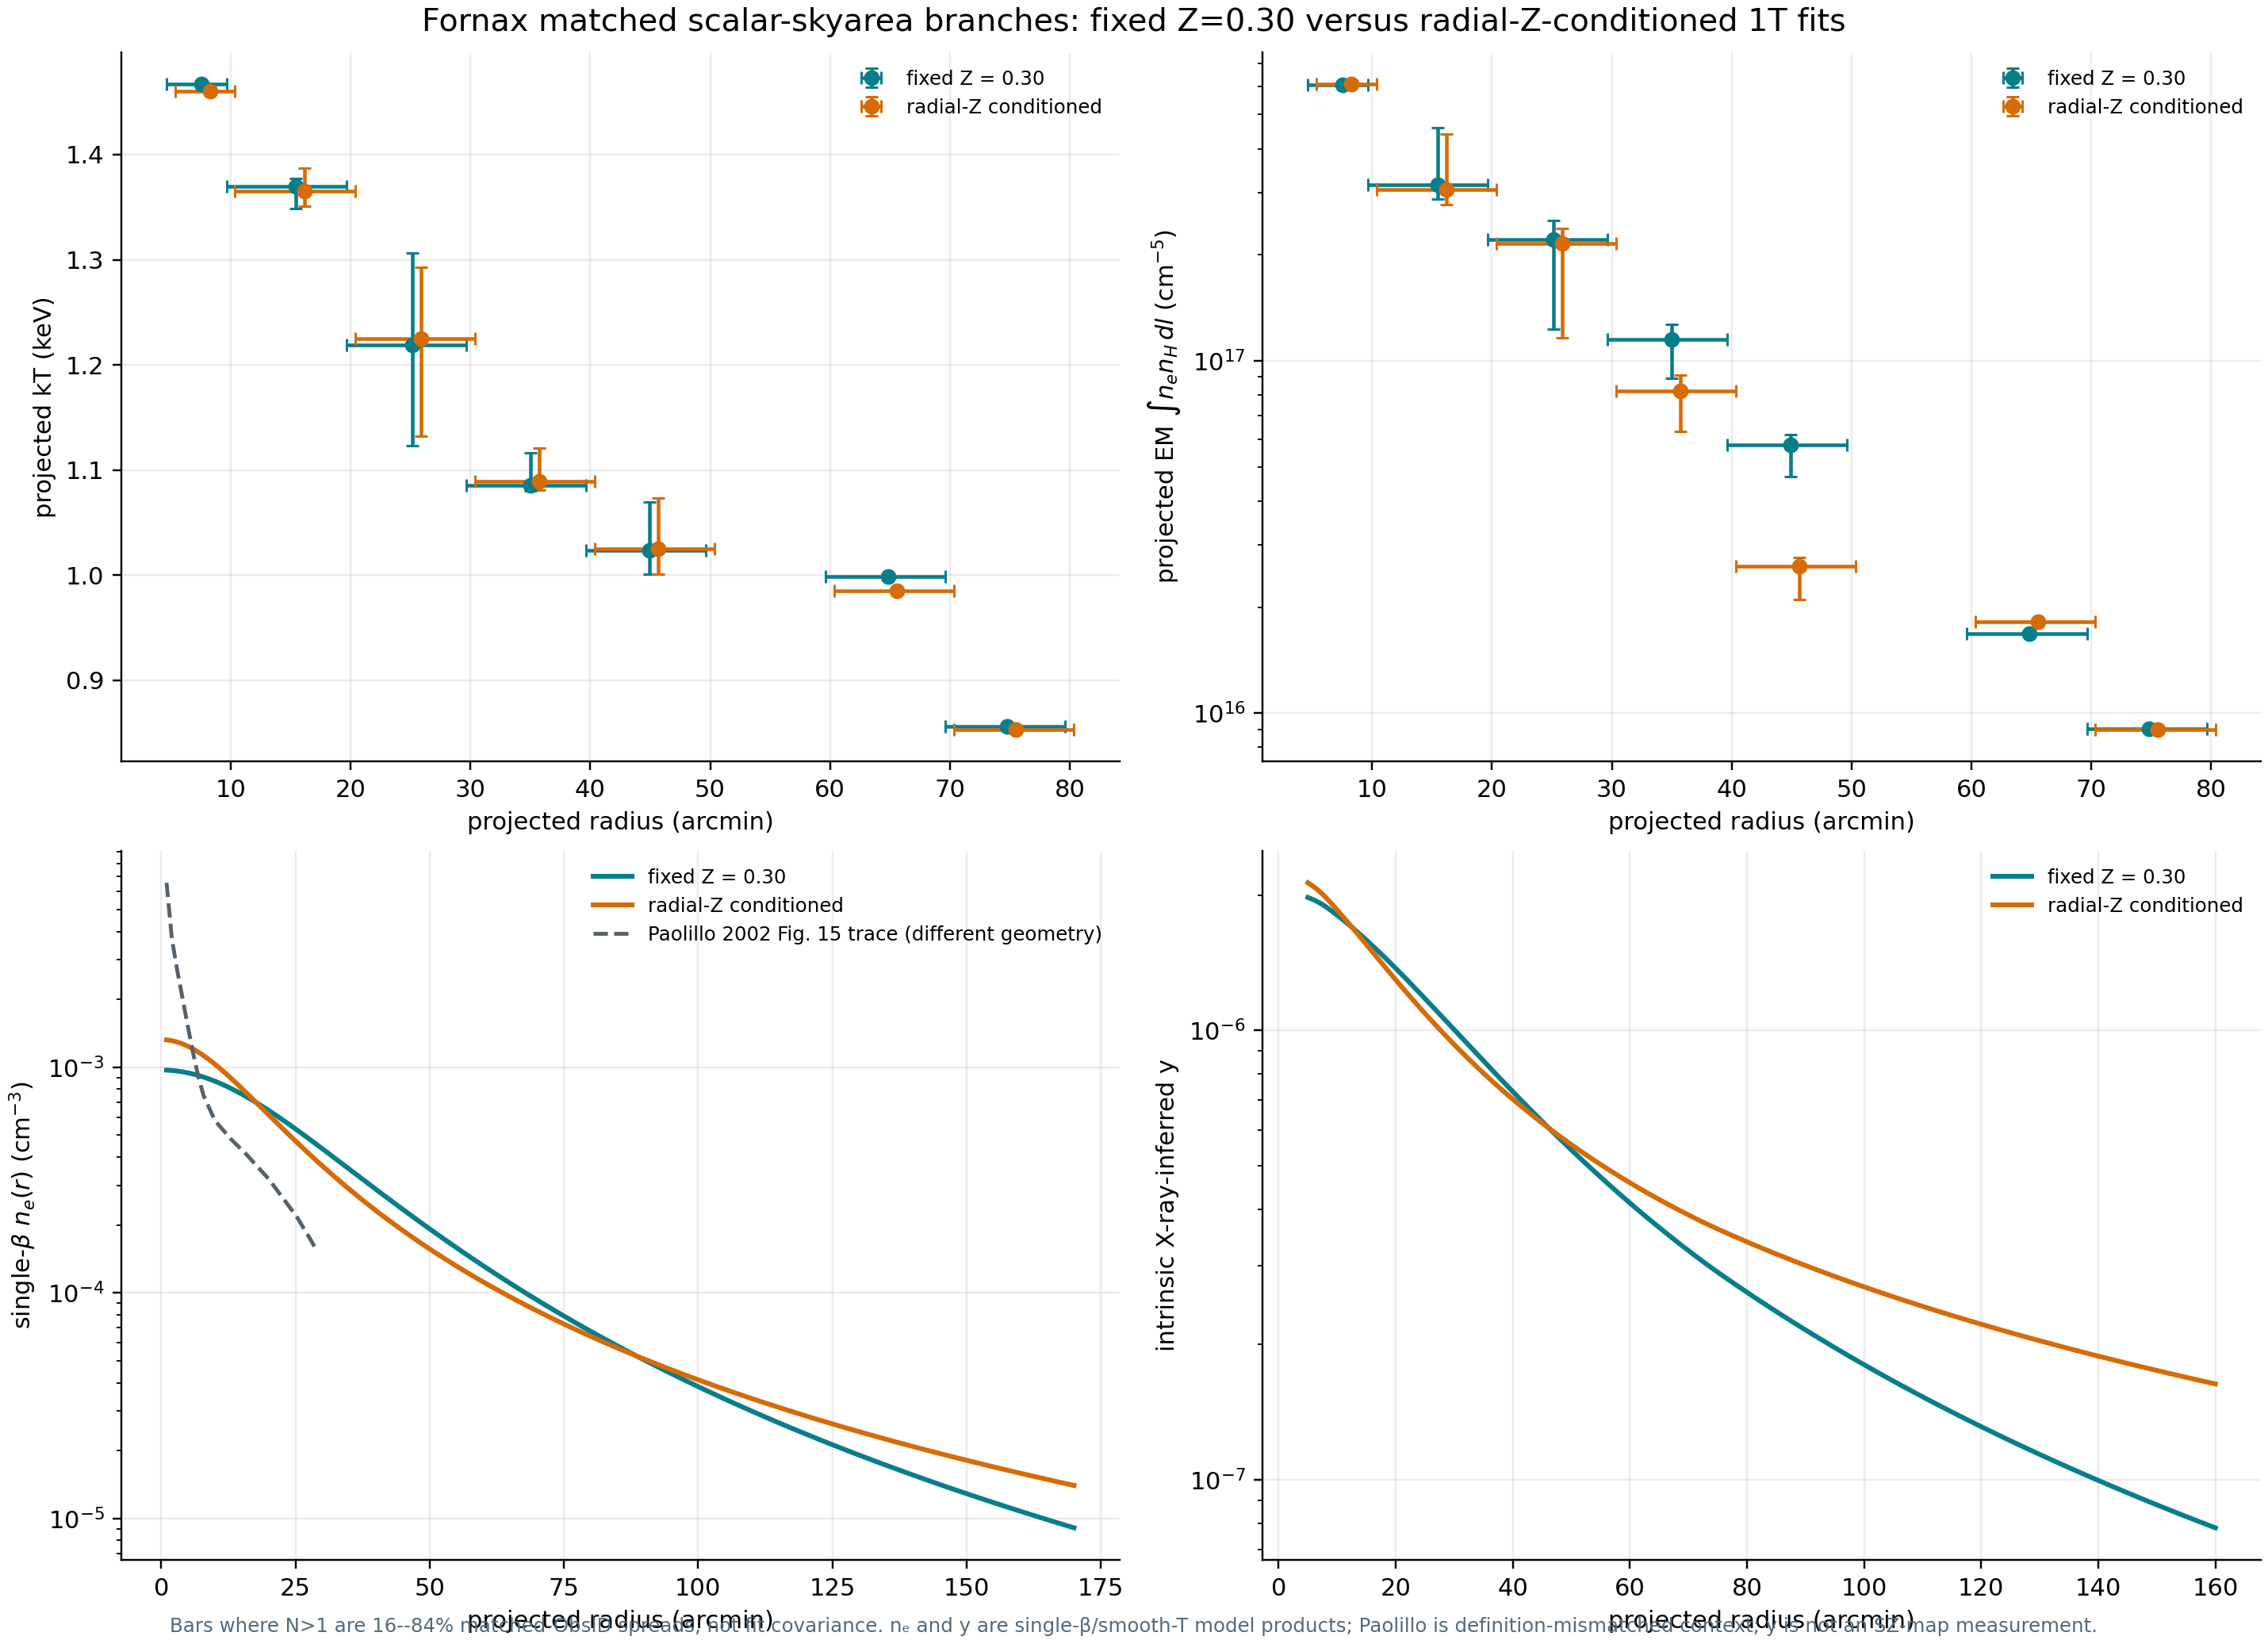
Fixed-Z and radial-Z-conditioned branches
Fixed-Z and radial-Z-conditioned branchesExactly matched ObsID pairs: the four panels compare kT, projected EM, single-beta nₑ, and intrinsic X-ray-inferred y.
QPB-subtracted radial surface brightness
QPB-subtracted radial surface brightnessMOS 0.5–2.0 keV radial diagnostic; overlapping bins remain diagnostics.
Legacy all-region spectral profile
Legacy all-region spectral profilePre-correction diagnostic only; not used in the current beta or y calculation.

02 · LITERATURE CHECK

Current measurements against public Fornax results

Temperature retains a point-by-point literature check; the current core comparison is matched-sample fixed-Z versus radial-Z EM, nₑ, and y, while literature density remains definition-limited context.
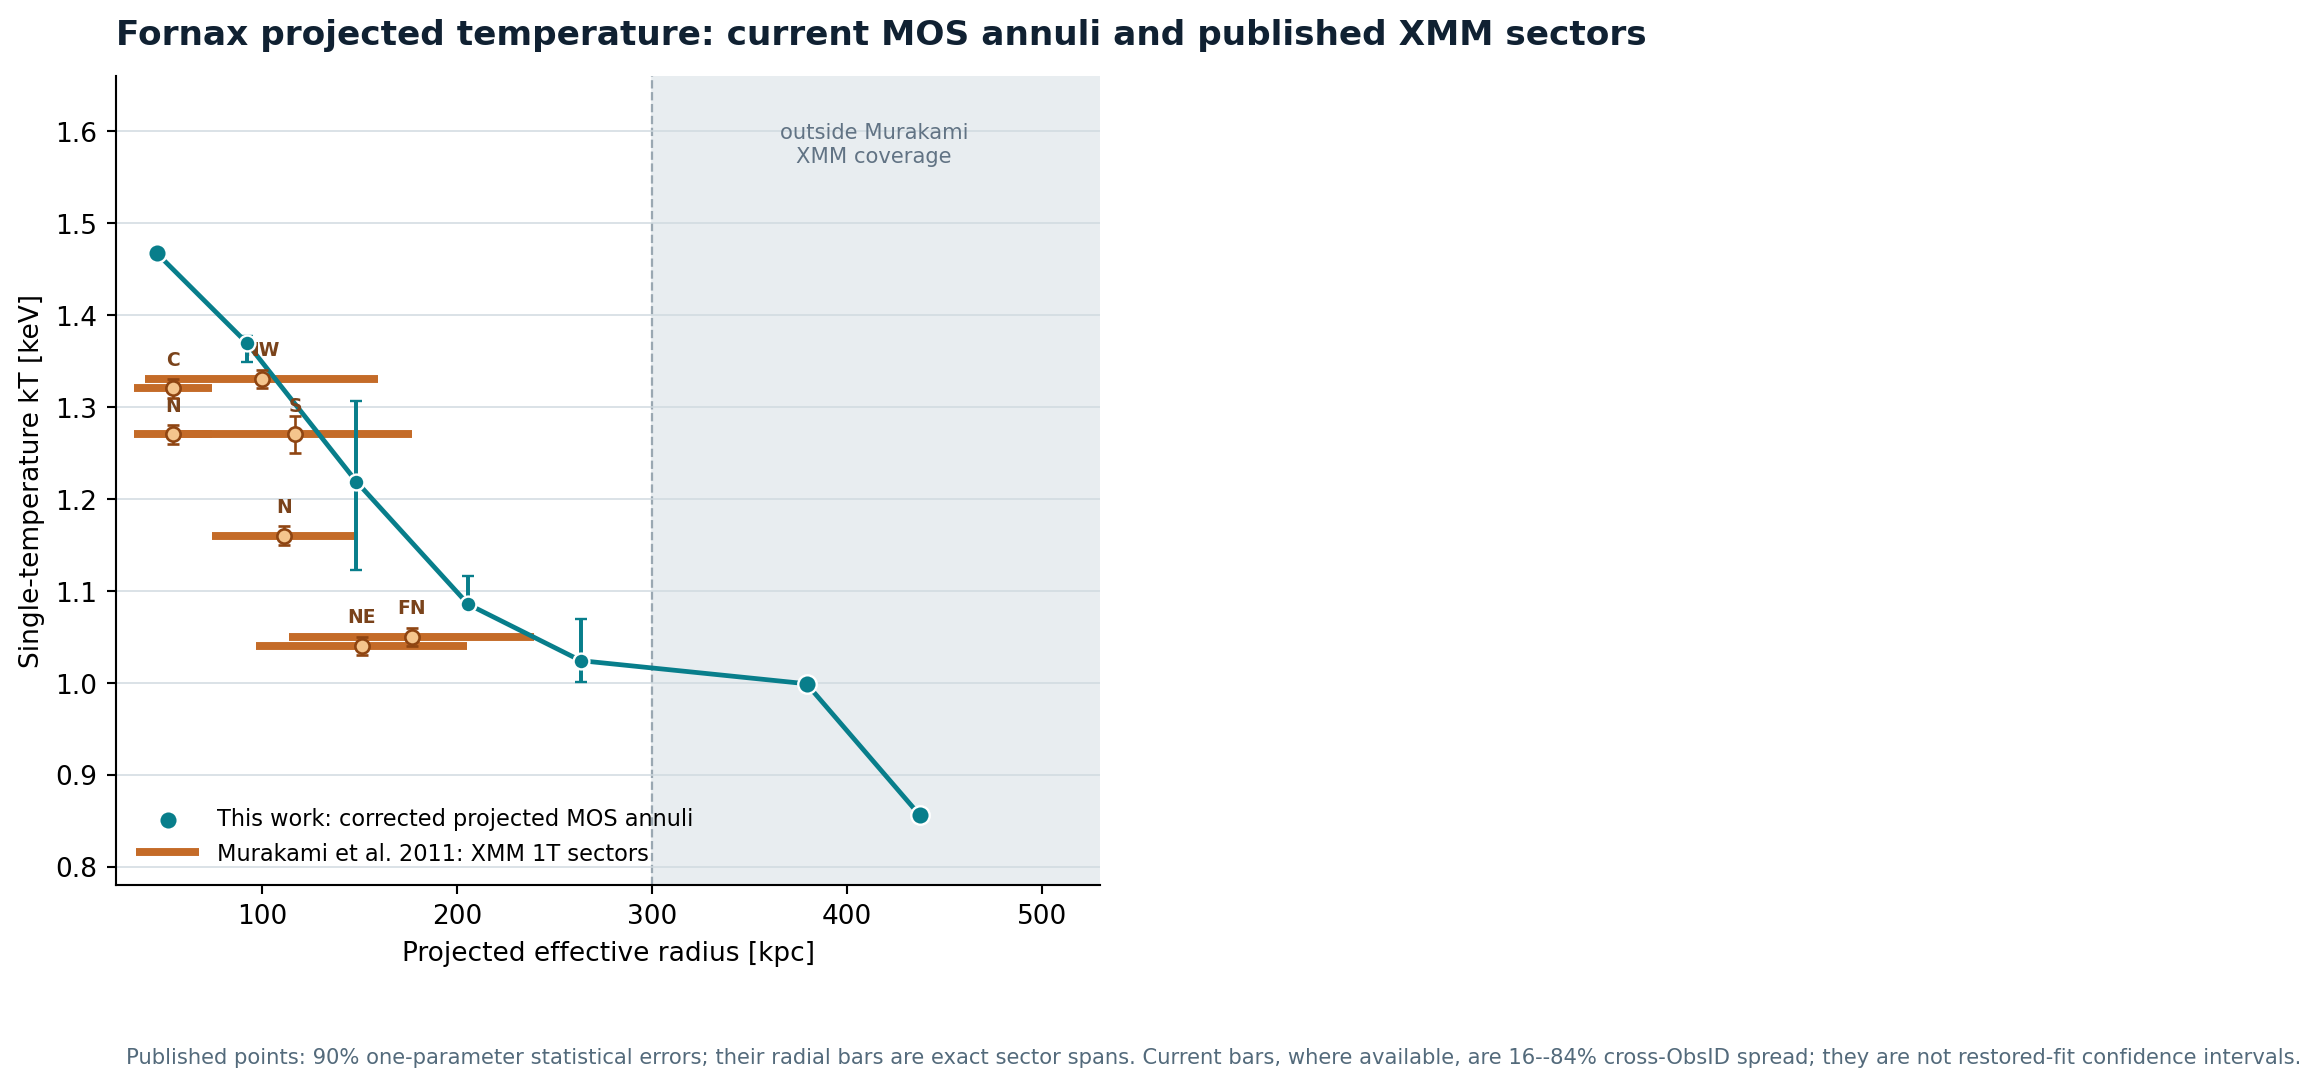
Comparison of current MOS projected temperatures with Murakami et al. 2011 XMM sector temperatures
Teal: current full-annulus MOS projected kT. Orange: original XMM single-temperature sector fits from Murakami et al. (2011). Bars retain their true radial spans rather than being re-averaged into points.
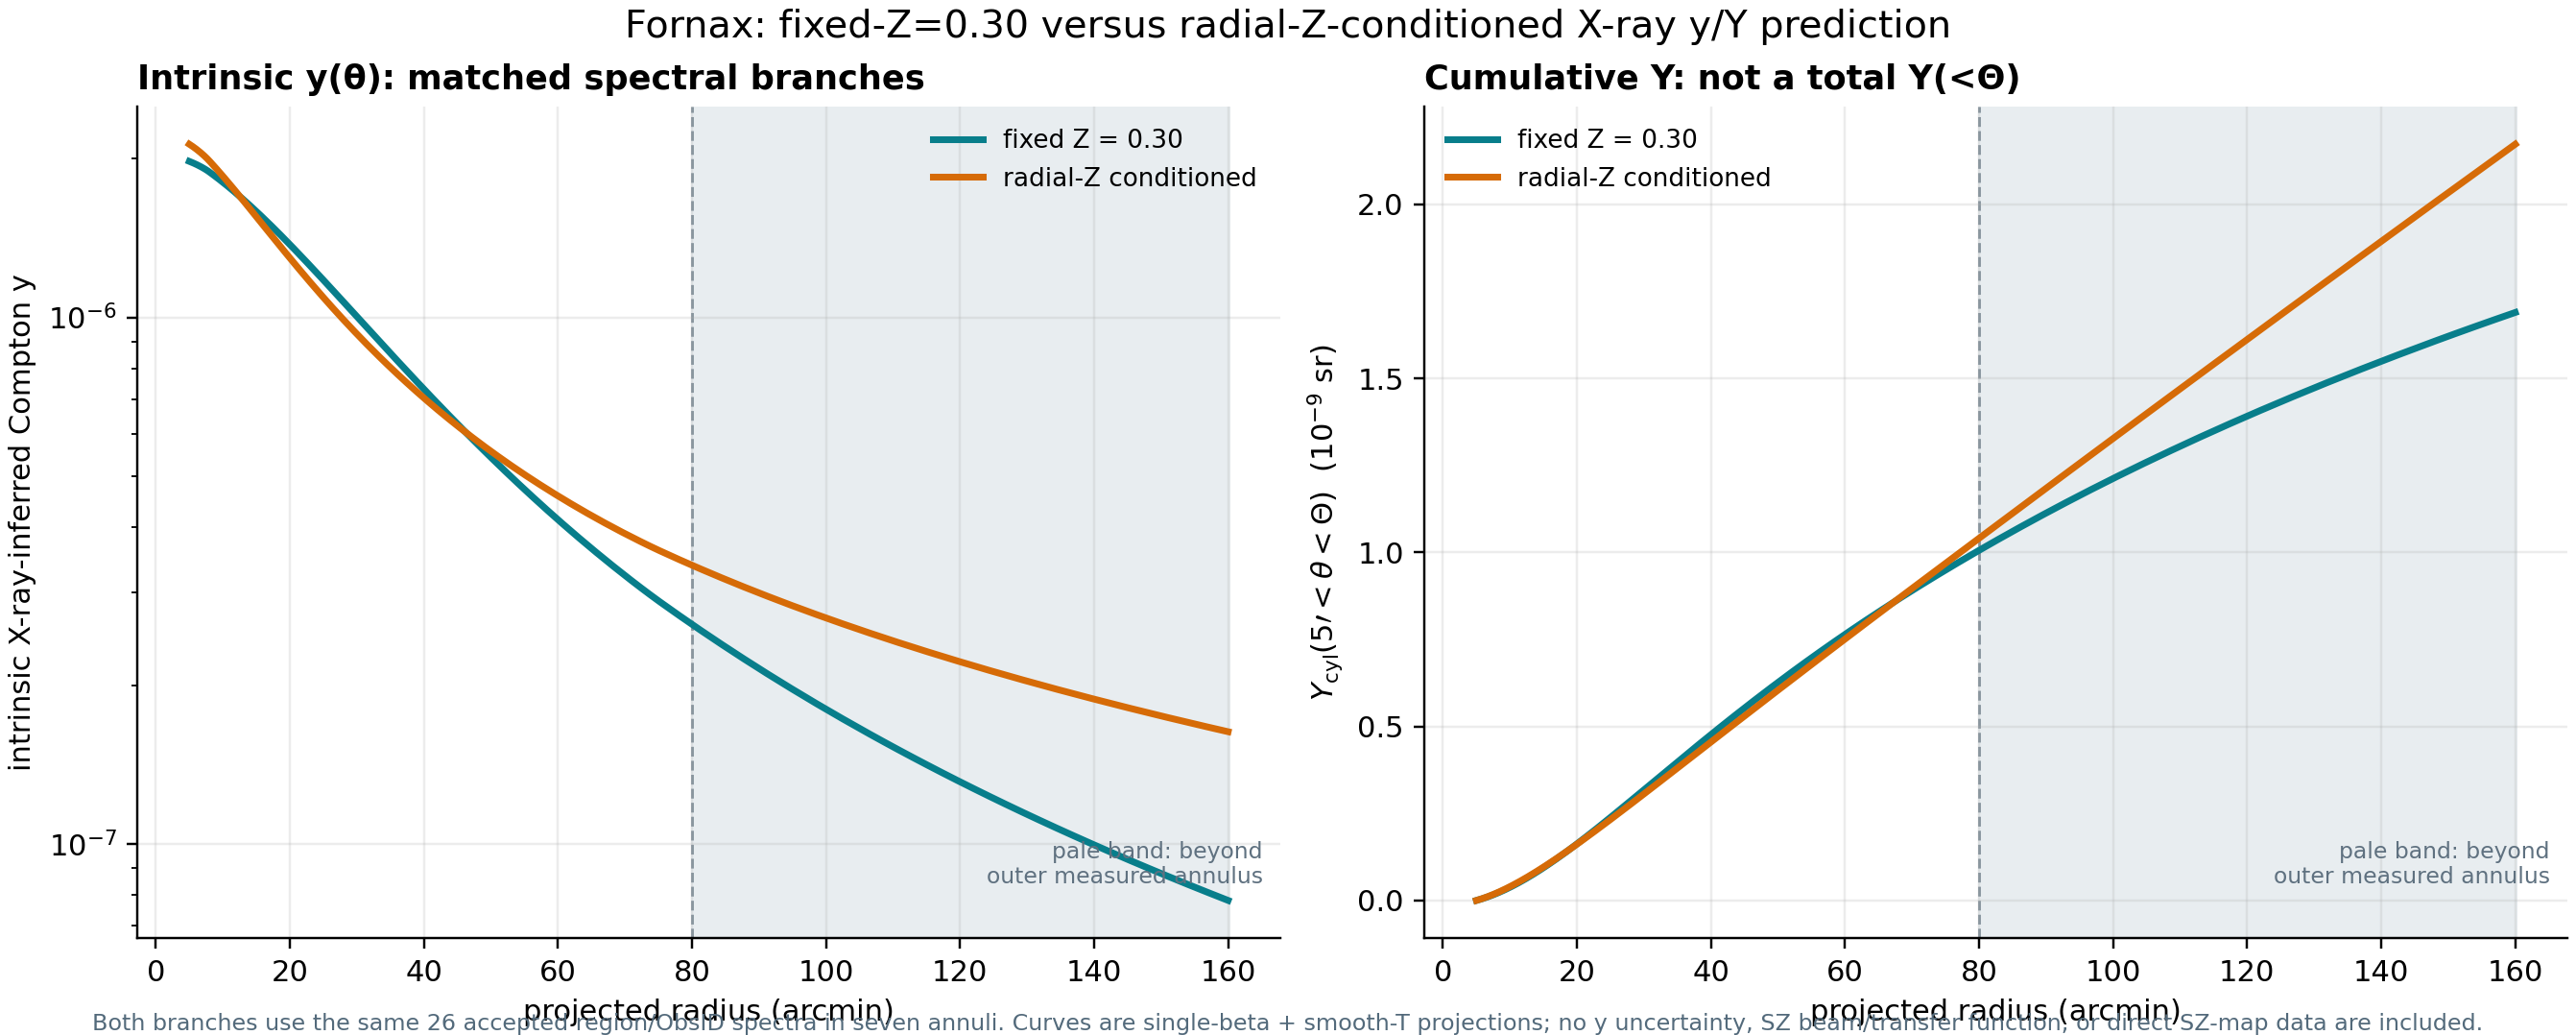
Comparison of fixed-metallicity and radial-metallicity-conditioned temperature, projected EM, electron density, and X-ray-inferred y
The branches use exactly the same accepted region/ObsID pairs; abundance is the only deliberately changed ICM parameter. Teal fixes Z=0.30; orange fixes each annulus to the radial-Z central value and reoptimizes kT, APEC norm, soft protons, and instrumental lines. R60–70 and R70–80 remain SrcApec source spectra; there is no R60–90 subtraction. R80–90 has no stable Z measurement and is excluded from both branches.
Fixed-metallicity and radial-metallicity-conditioned X-ray-inferred y and cumulative Y
Left: unconvolved X-ray-conditioned Compton y(θ). Right: Ycyl from 5′ to Θ, not total Y(<Θ). Both curves use the same 26 region/ObsID spectra in seven annuli. The pale band beyond 80′ is only the single-beta density plus smooth-temperature continuation; no y/Y uncertainty, SZ beam/transfer function, or Joel SZ-map curve is included.
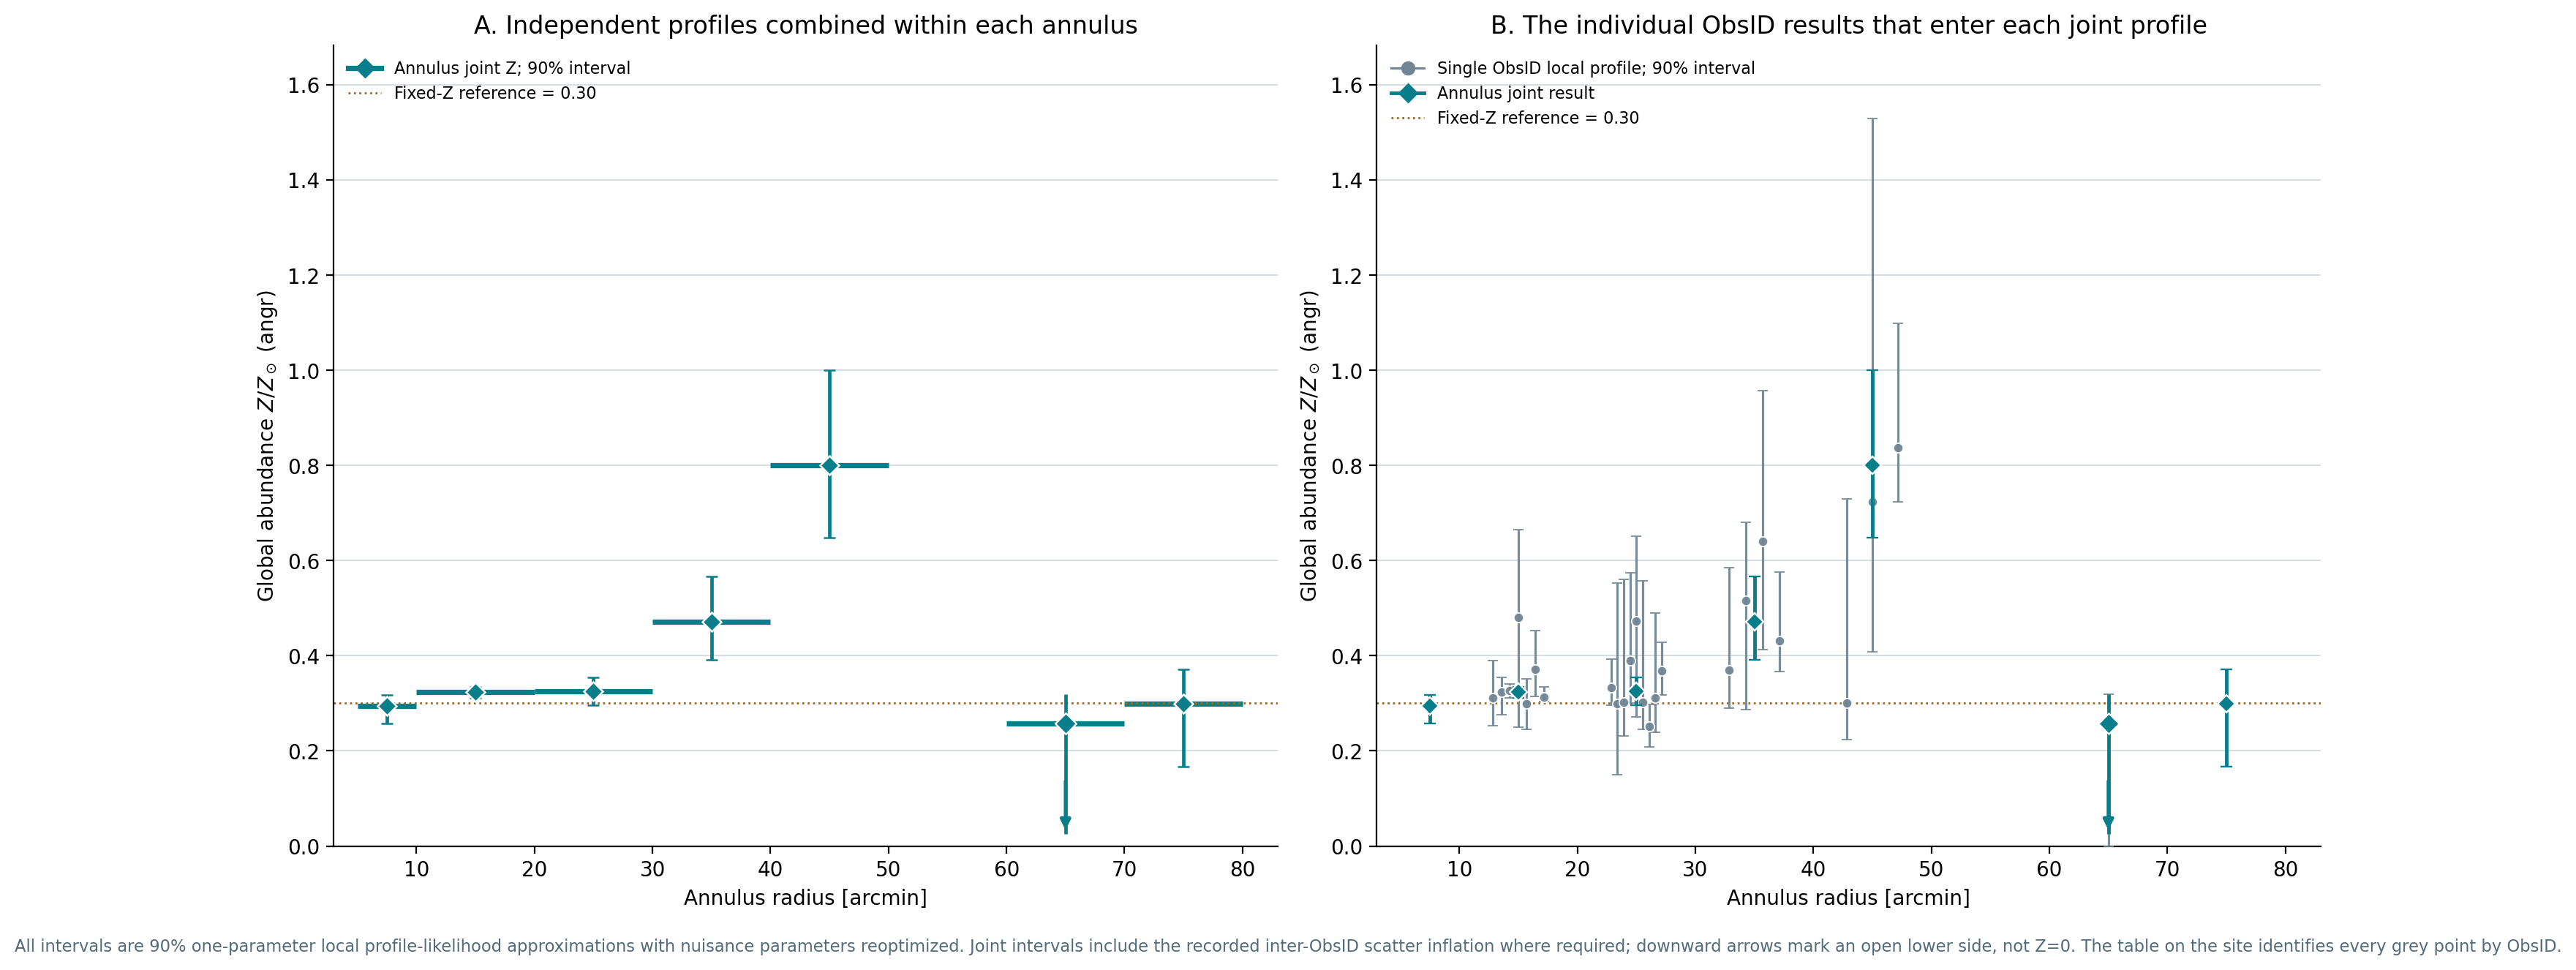
Refit radial global metallicity measurements with 90% statistical intervals
Left: the 1T global Z (XSPEC angr) obtained by combining independent ObsID local profiles within the same annulus, retaining its true radial span and 90% interval. Right: every individual ObsID entering that joint result with its own 90% range; the teal diamond is the same joint value, not another spectral fit.
Joint and individual-ObsID values by annulus (90%) +

regionR5-10

R5–10

Joint result: Z=0.294; 90% [0.257, 0.318]; N=1

Inter-ObsID interval scale: 1.000

Individual ObsID resultsObsIDZ / Z⊙90% lower90% upperMOS spectra
R5–1000551401010.2940.2570.3182

regionR10-20

R10–20

Joint result: Z=0.323; 90% [0.312, 0.334]; N=7

Inter-ObsID interval scale: 1.000

Individual ObsID resultsObsIDZ / Z⊙90% lower90% upperMOS spectra
R10–2000128301010.3110.2530.3892
R10–2003049401010.3240.2760.3542
R10–2004006201010.3270.3110.3412
R10–2005509301010.4810.2500.6661
R10–2005509310010.2990.2450.3512
R10–2005509314010.3720.3150.4532
R10–2007813501010.3130.3050.3342

regionR20-30

R20–30

Joint result: Z=0.325; 90% [0.297, 0.355]; N=9

Inter-ObsID interval scale: 1.209

Individual ObsID resultsObsIDZ / Z⊙90% lower90% upperMOS spectra
R20–3000551401010.3320.2960.3921
R20–3001409502010.2990.1500.5532
R20–3003049401010.3020.2310.5612
R20–3005509303010.3890.3000.5742
R20–3005509304010.4730.2710.6512
R20–3005509305010.3020.2460.5572
R20–3005509310010.2510.2080.2982
R20–3005509314010.3110.2390.4902
R20–3007813501010.3690.3180.4282

regionR30-40

R30–40

Joint result: Z=0.472; 90% [0.392, 0.566]; N=4

Inter-ObsID interval scale: 1.000

Individual ObsID resultsObsIDZ / Z⊙90% lower90% upperMOS spectra
R30–4001409502010.3710.2900.5862
R30–4005509303010.5170.2860.6802
R30–4005509304010.6400.4130.9572
R30–4005509305010.4320.3670.5772

regionR40-50

R40–50

Joint result: Z=0.800; 90% [0.648, 1.000]; N=3

Inter-ObsID interval scale: 1.411

Individual ObsID resultsObsIDZ / Z⊙90% lower90% upperMOS spectra
R40–5001409502010.3010.2240.7292
R40–5005509304010.7230.4091.5302
R40–5005509305010.8370.7241.0982

regionR60-70

R60–70

Joint result: Z=0.258; 90% [open (scan reaches 0), 0.319]; N=1

Inter-ObsID interval scale: 1.000

Individual ObsID resultsObsIDZ / Z⊙90% lower90% upperMOS spectra
R60–7002055903010.2580.0000.3192

regionR70-80

R70–80

Joint result: Z=0.299; 90% [0.166, 0.371]; N=1

Inter-ObsID interval scale: 1.000

Individual ObsID resultsObsIDZ / Z⊙90% lower90% upperMOS spectra
R70–8002055903010.2990.1660.3712

Unstable free-Z profiles not included in a joint result: R30–40 / 0550931001 · R40–50 / 0550930301 · R80–90 / 0205590301. They remained unstable after three side-probe restarts, so no interval is displayed and none enters a joint value.

SOURCES

Primary public references

Links lead to original papers; the scope each source can support is stated above.

03 · REGION BY REGION

Best-fit spectral atlas

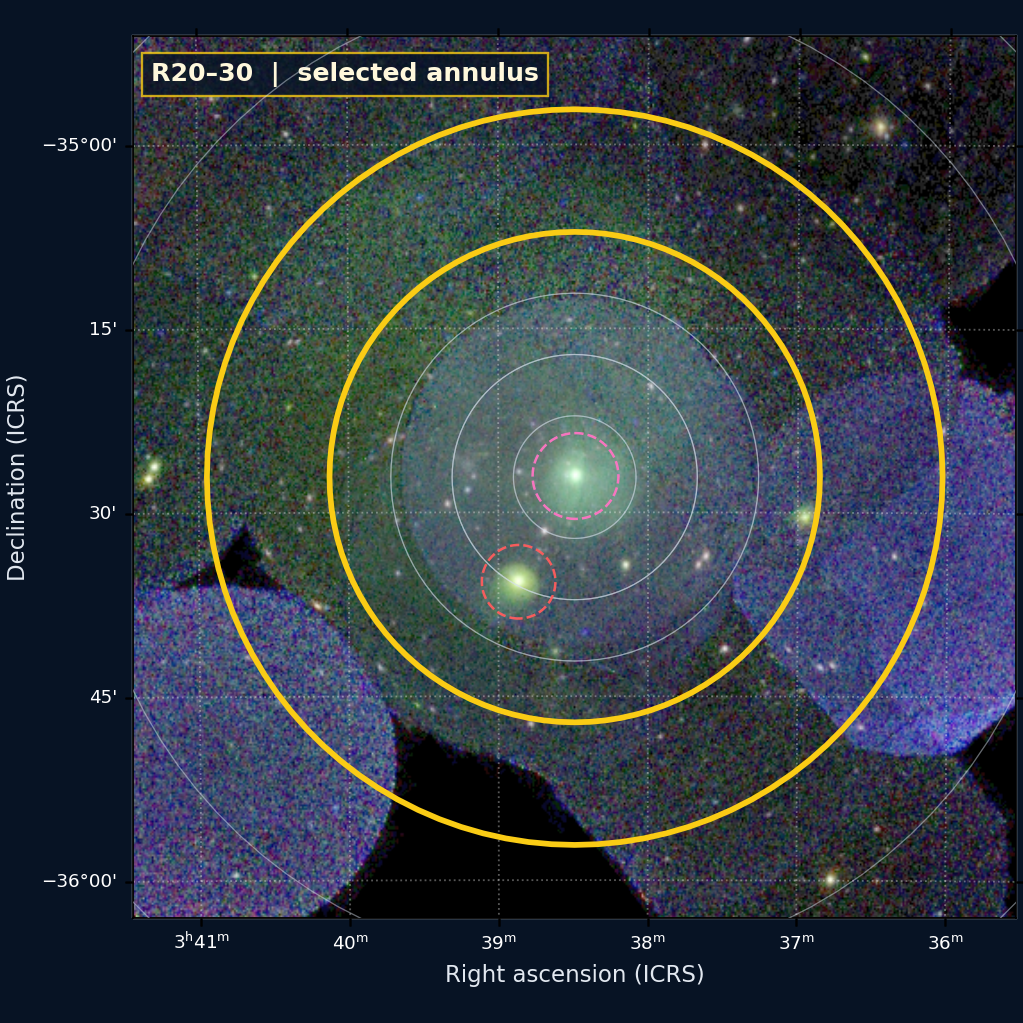
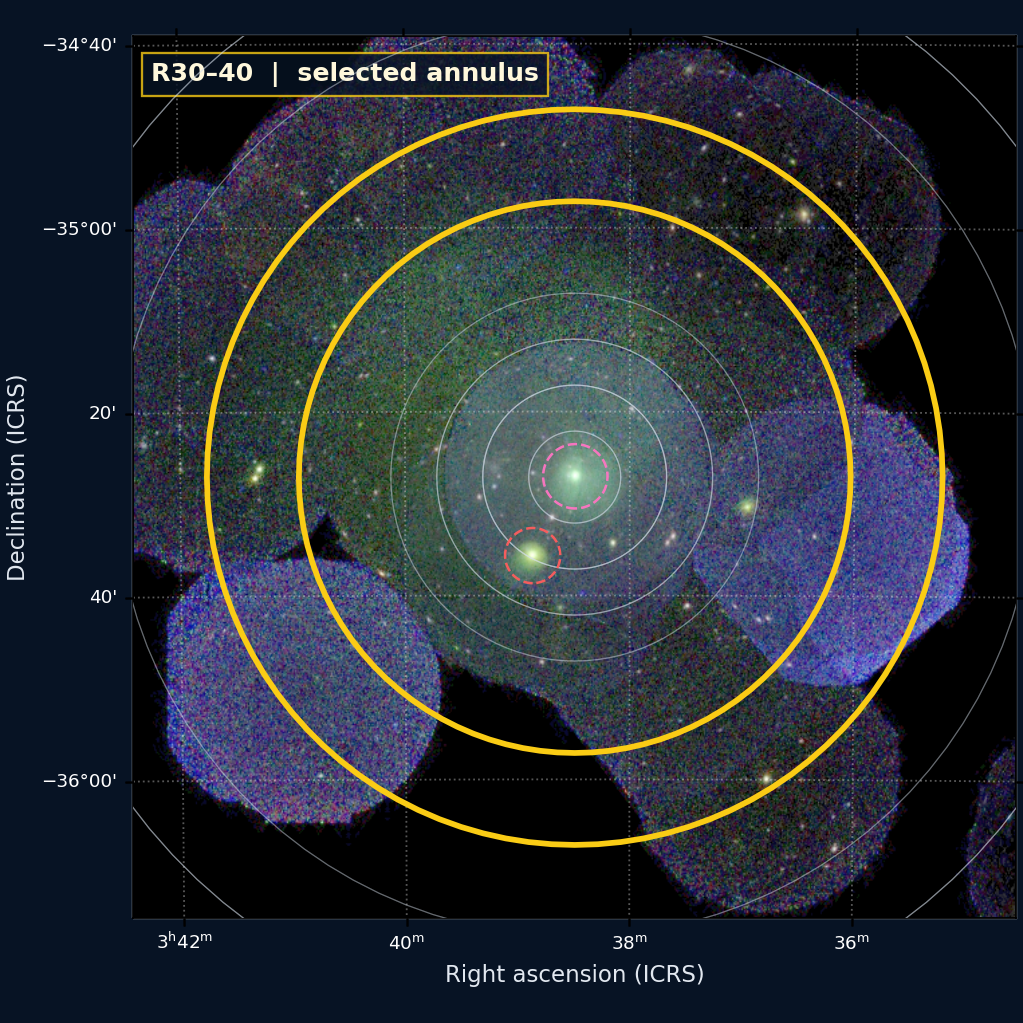
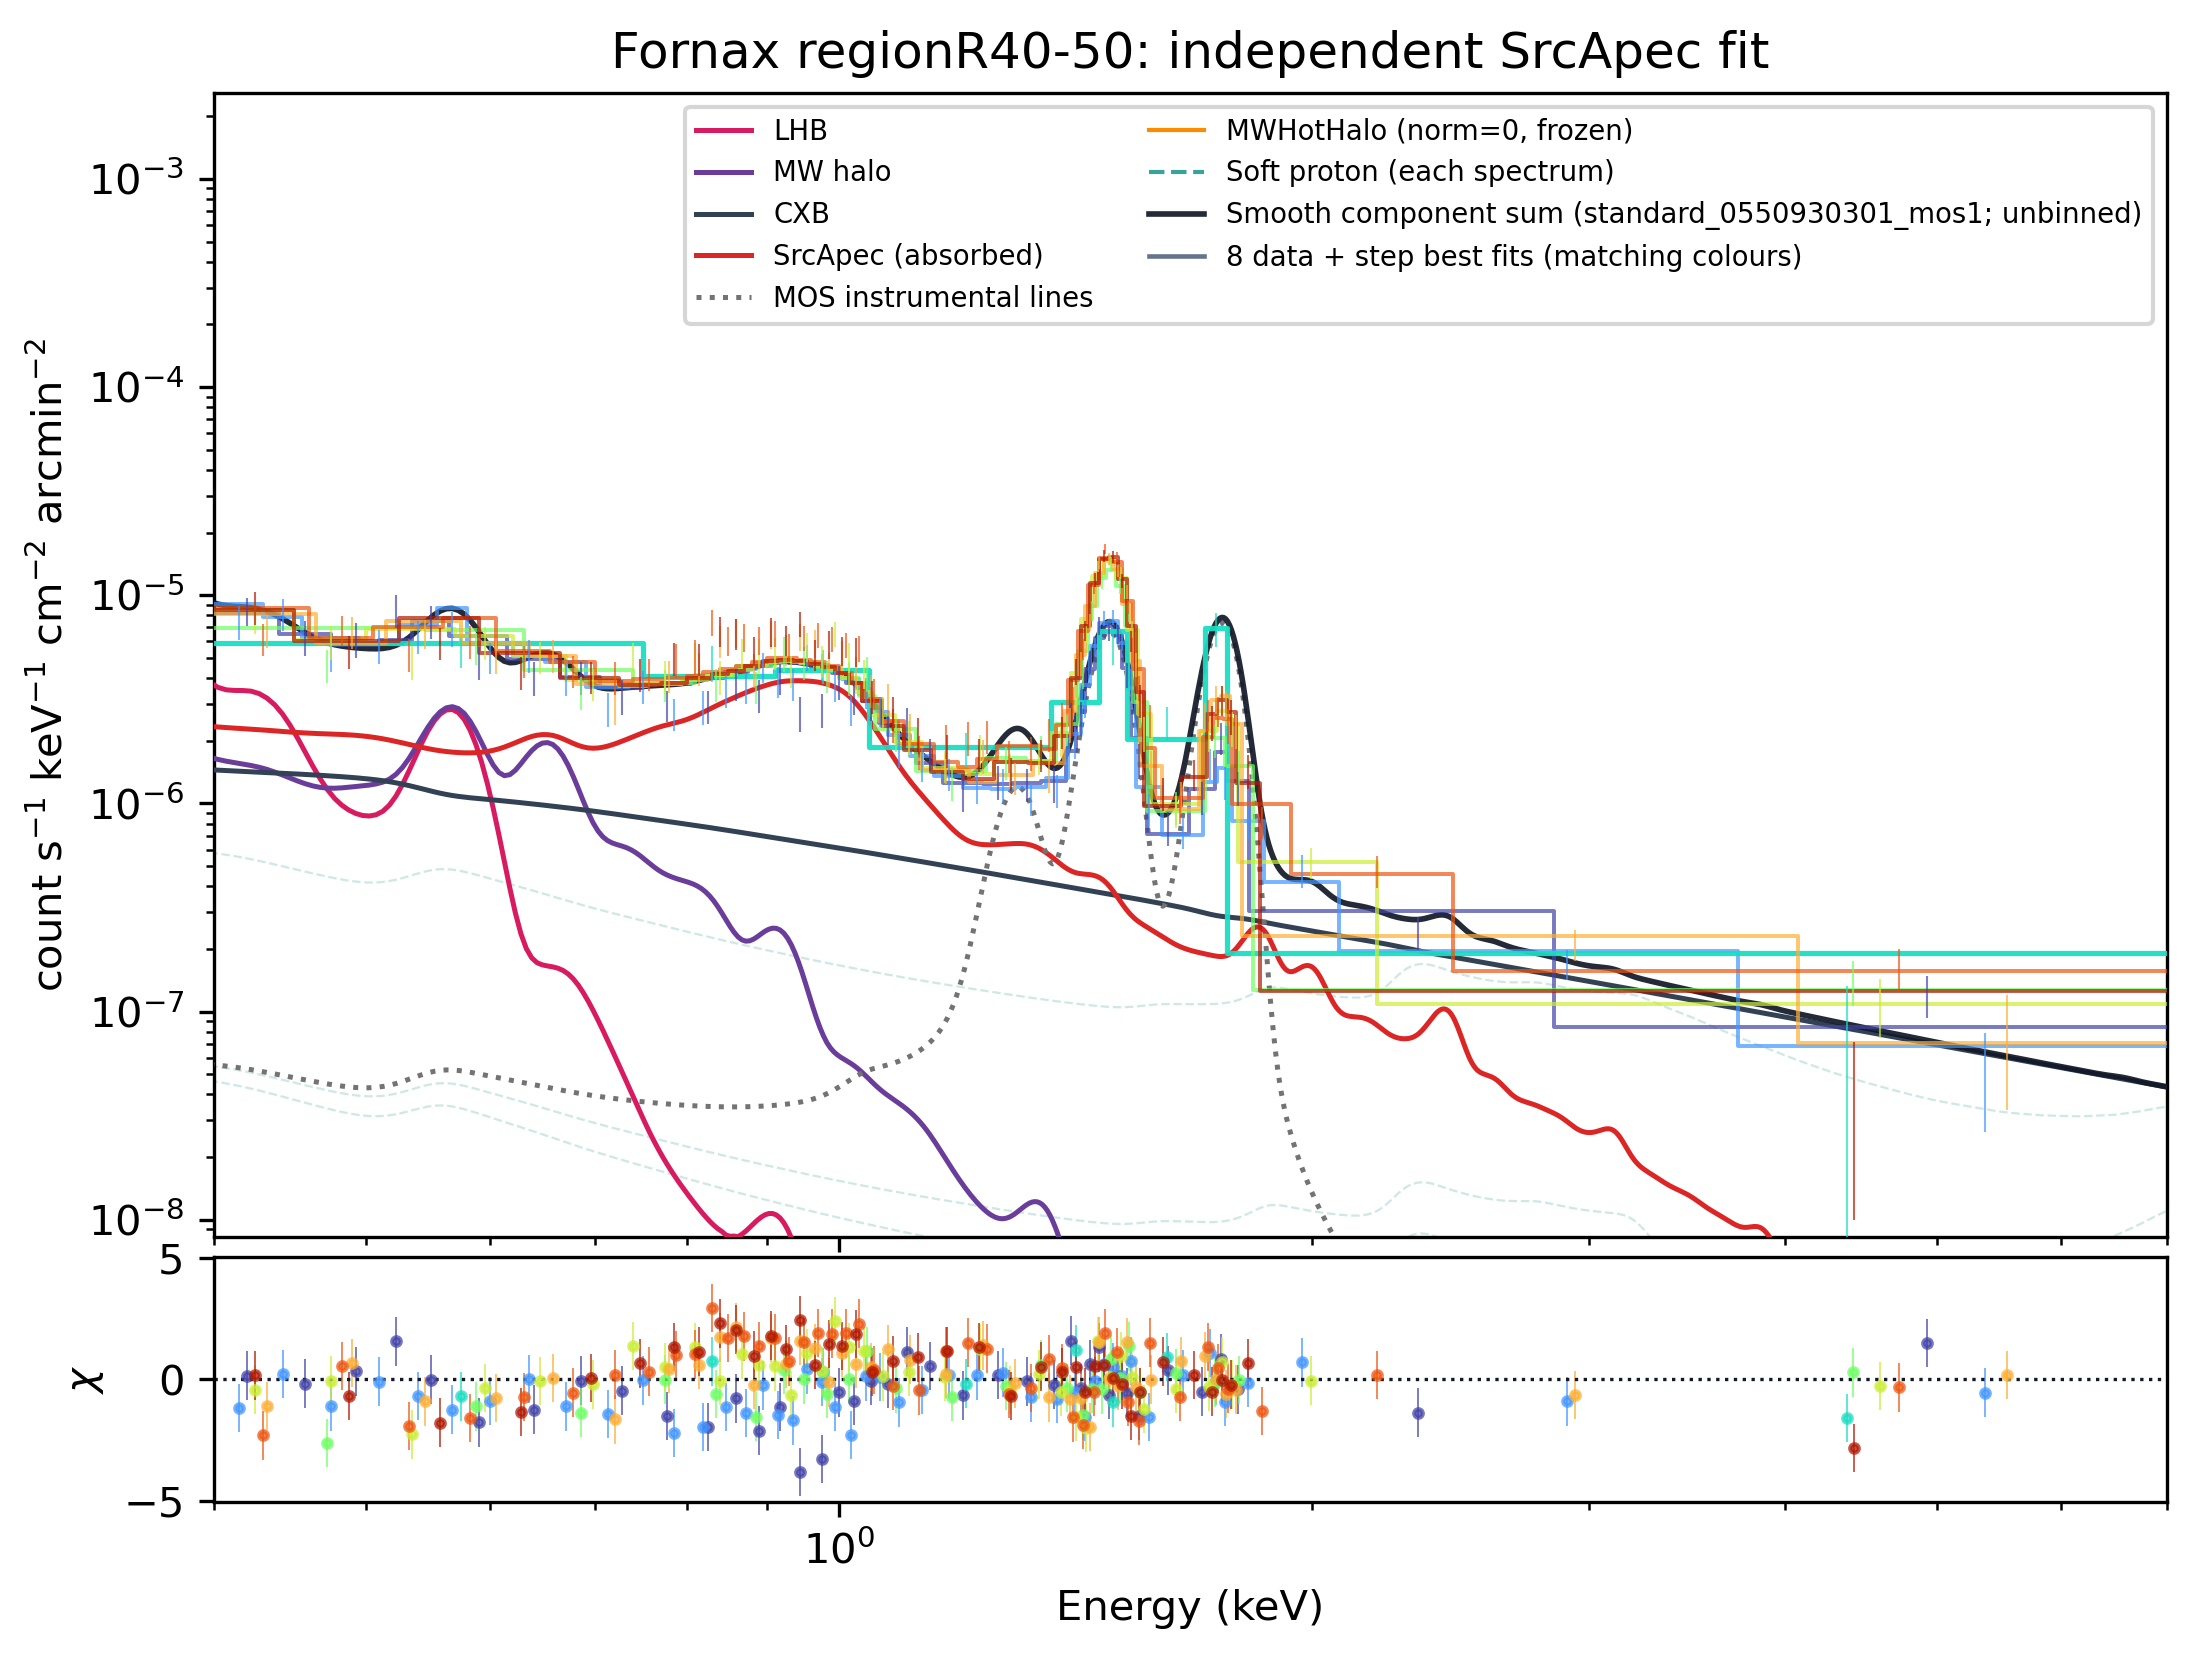
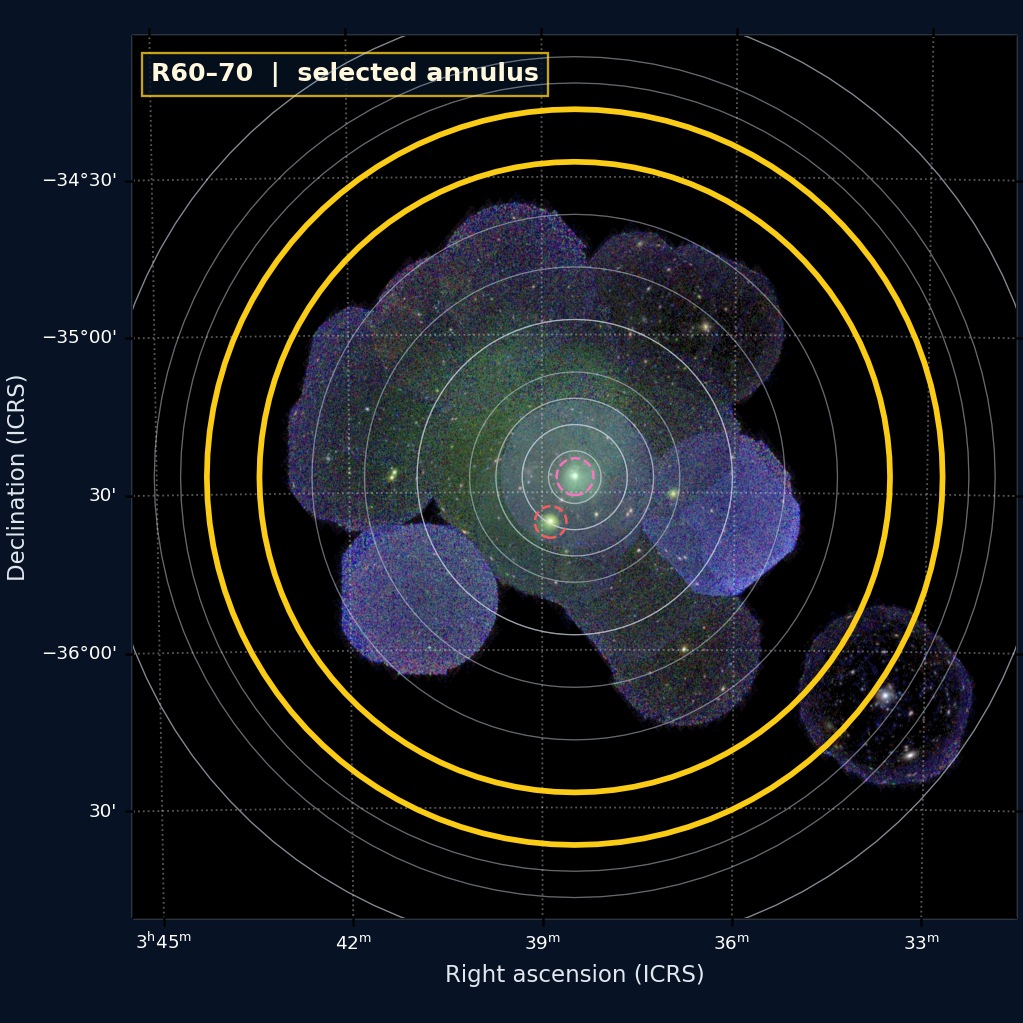
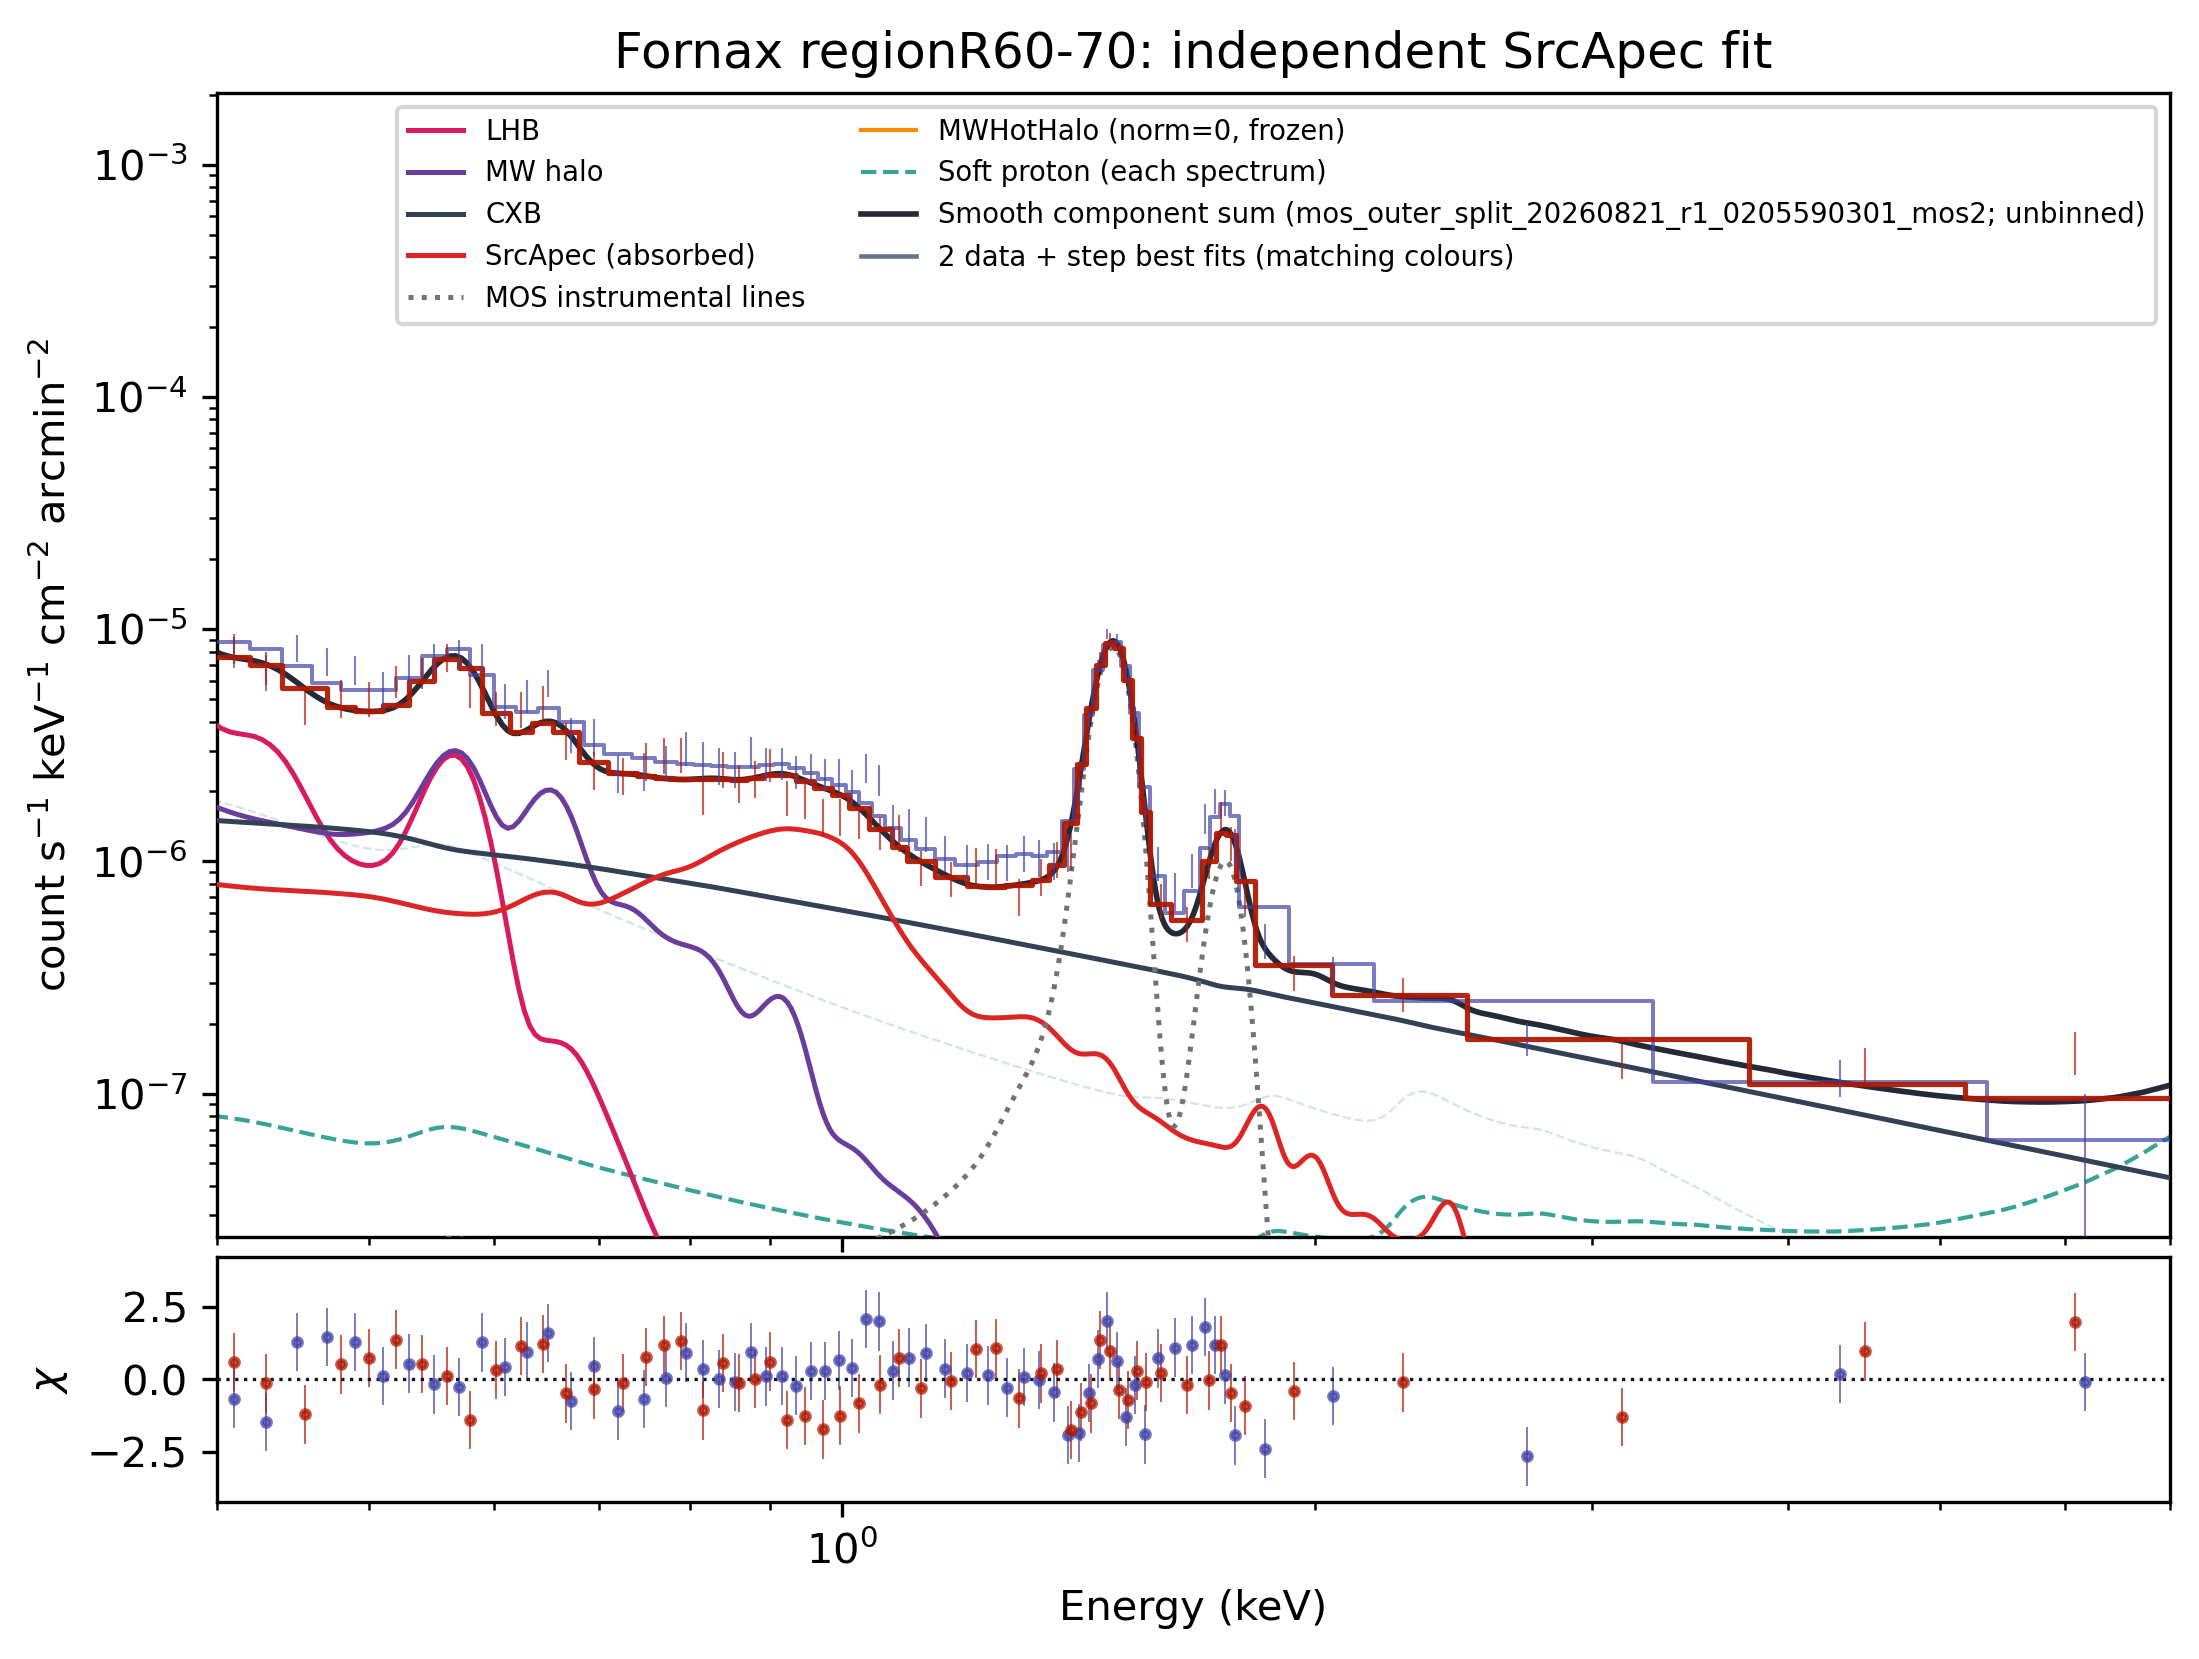
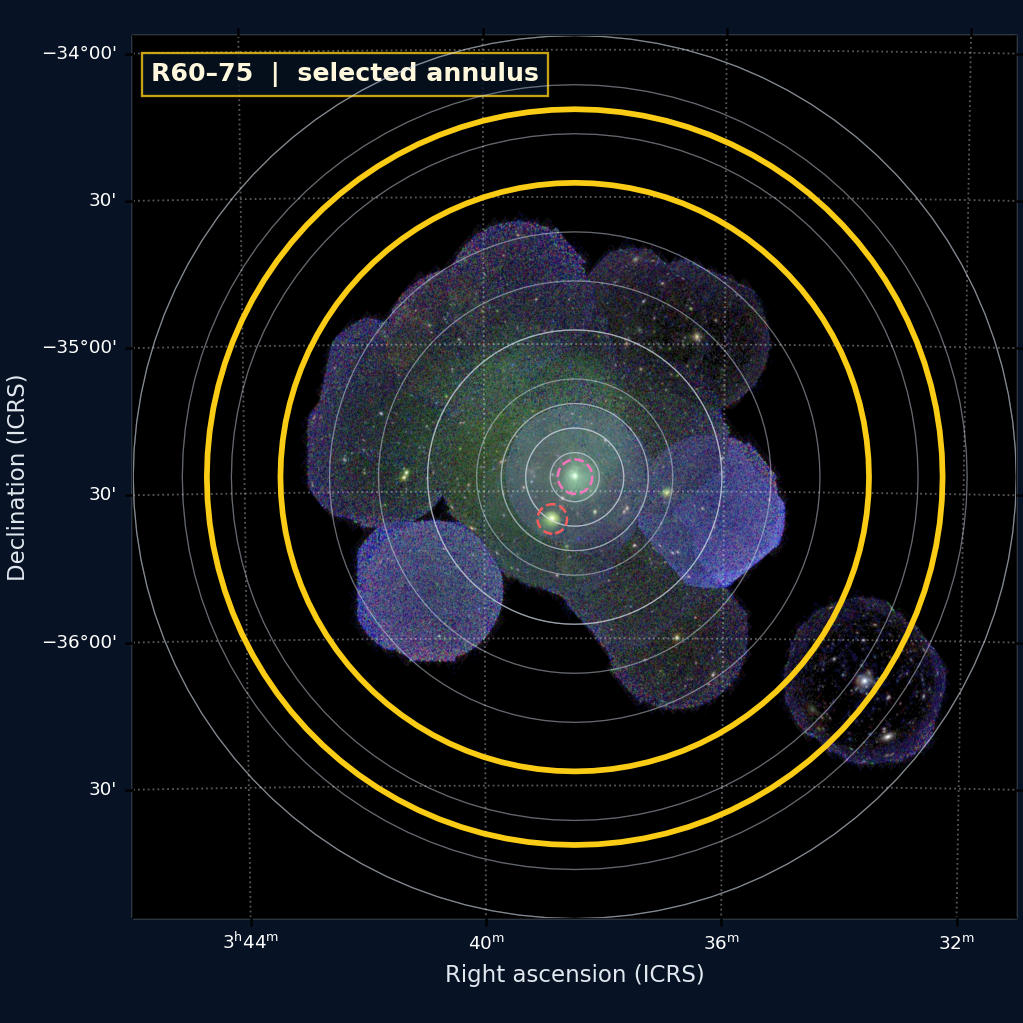
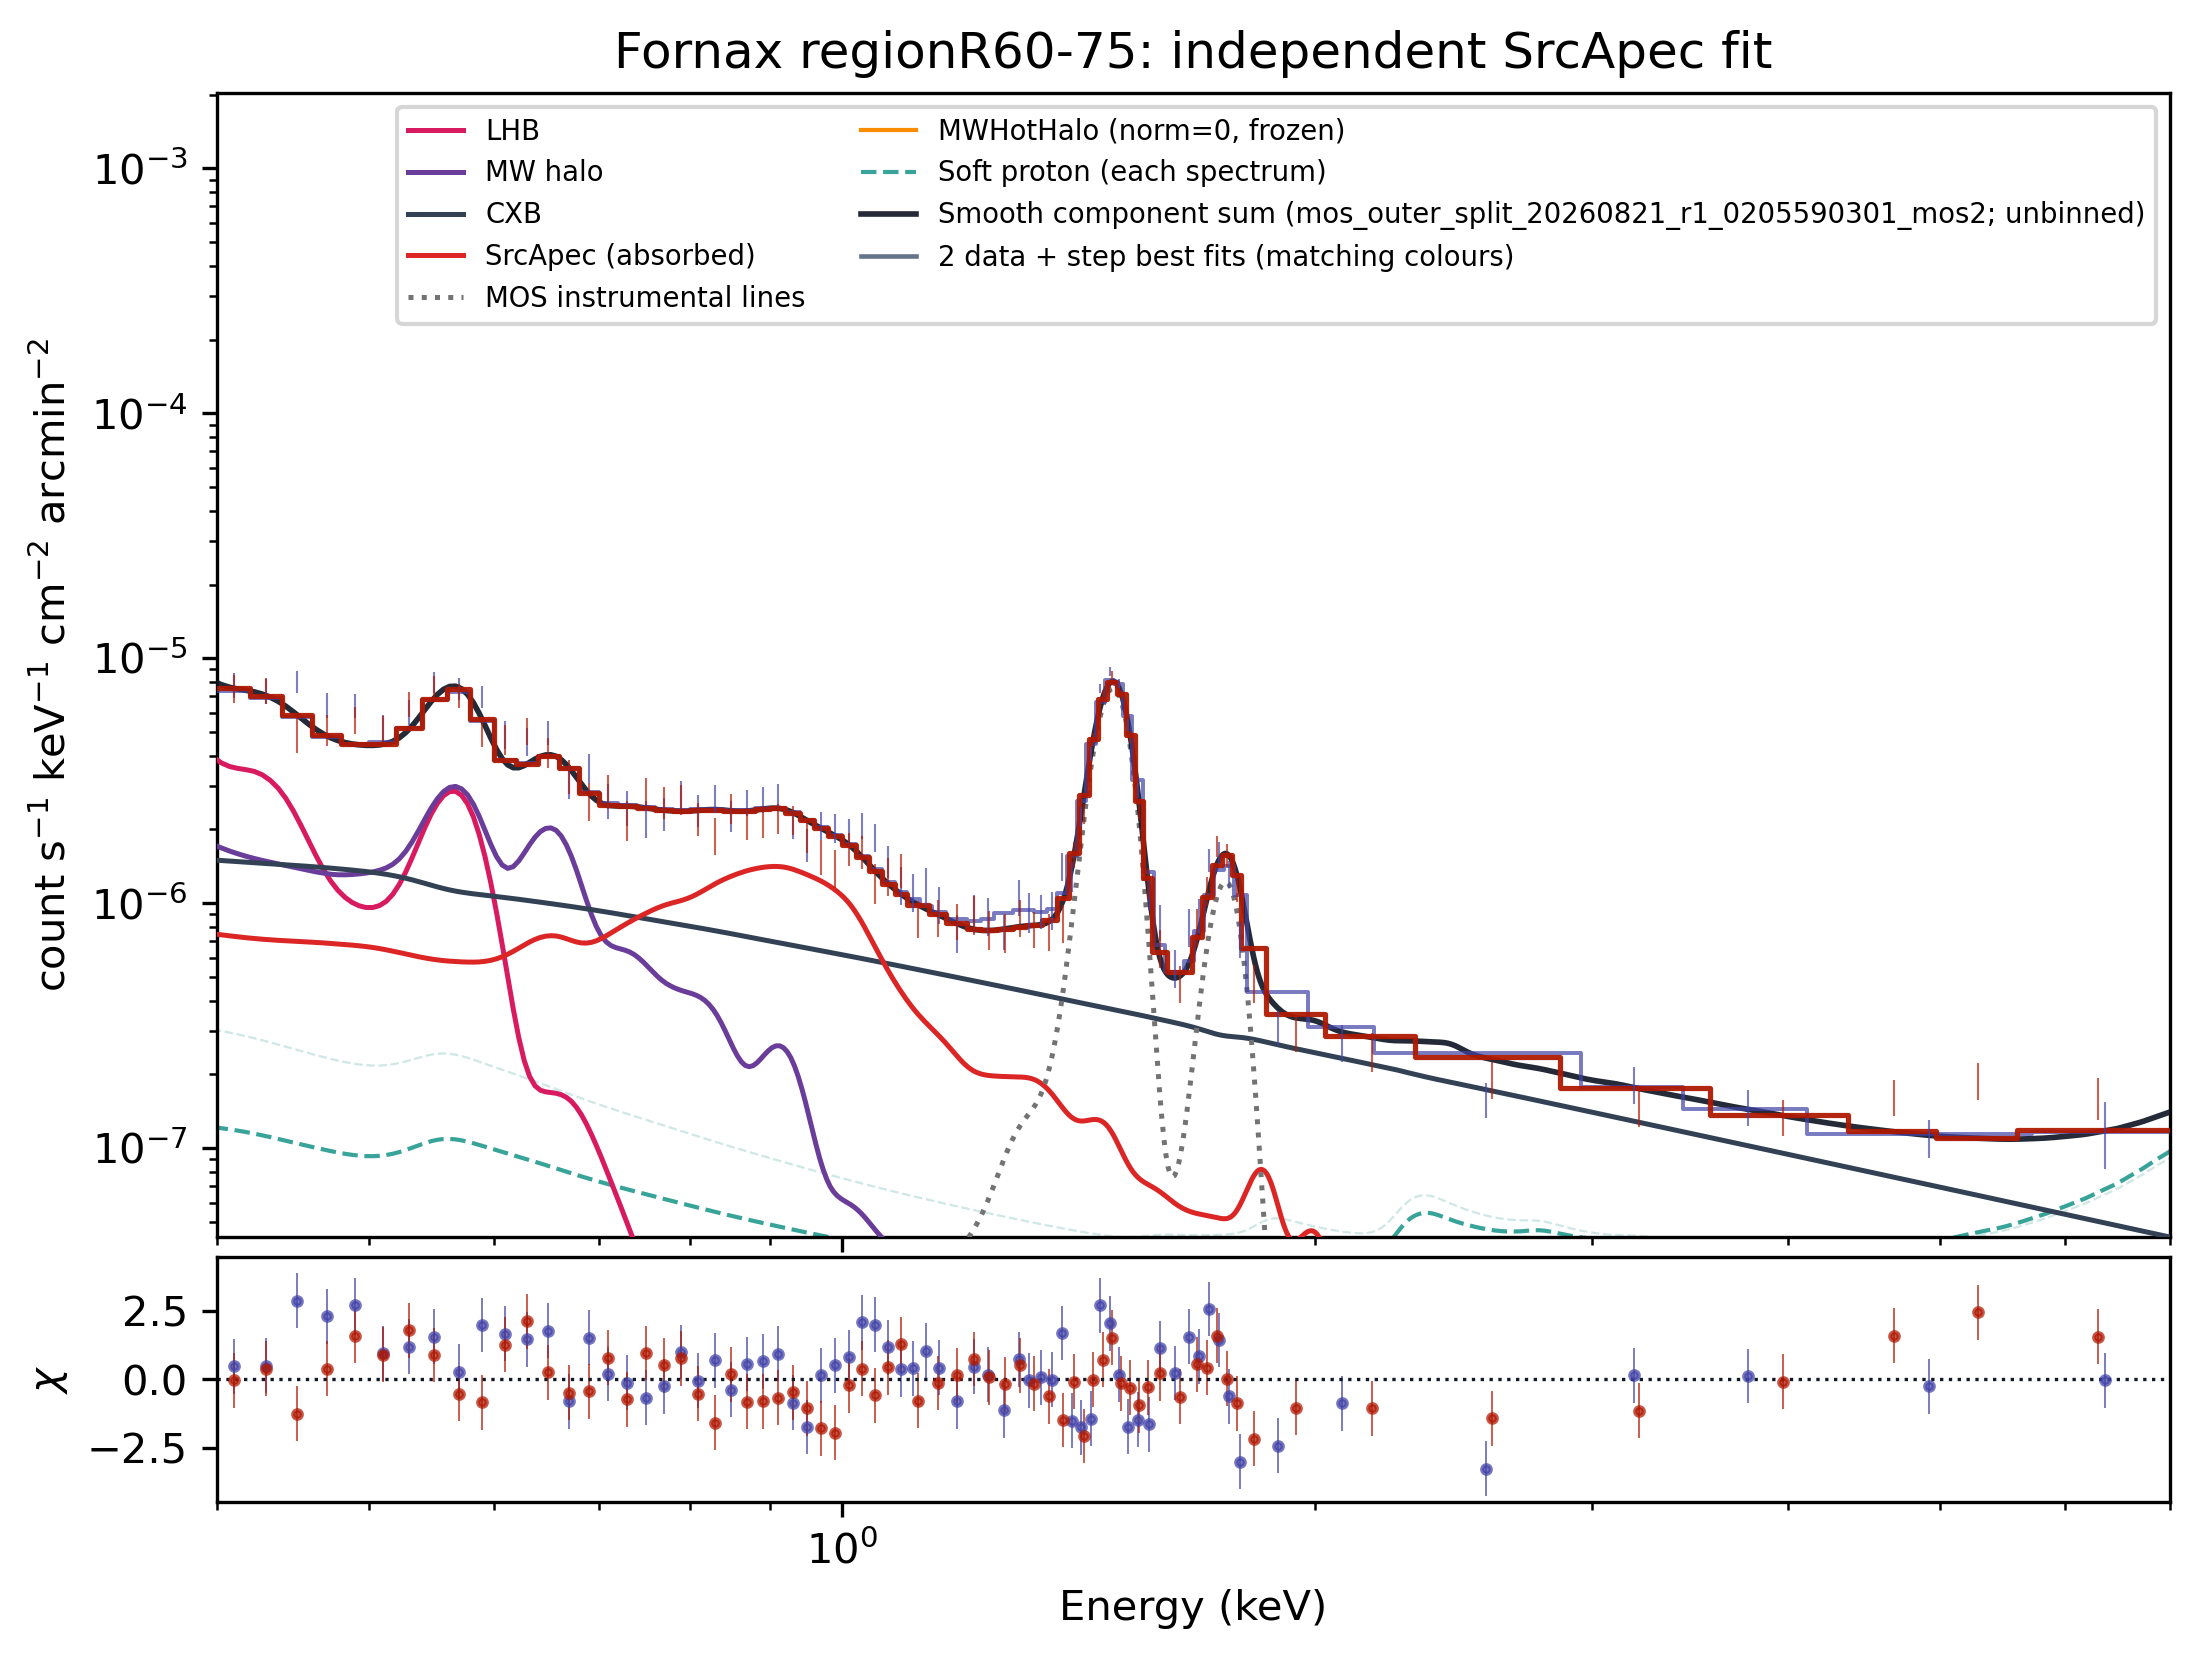
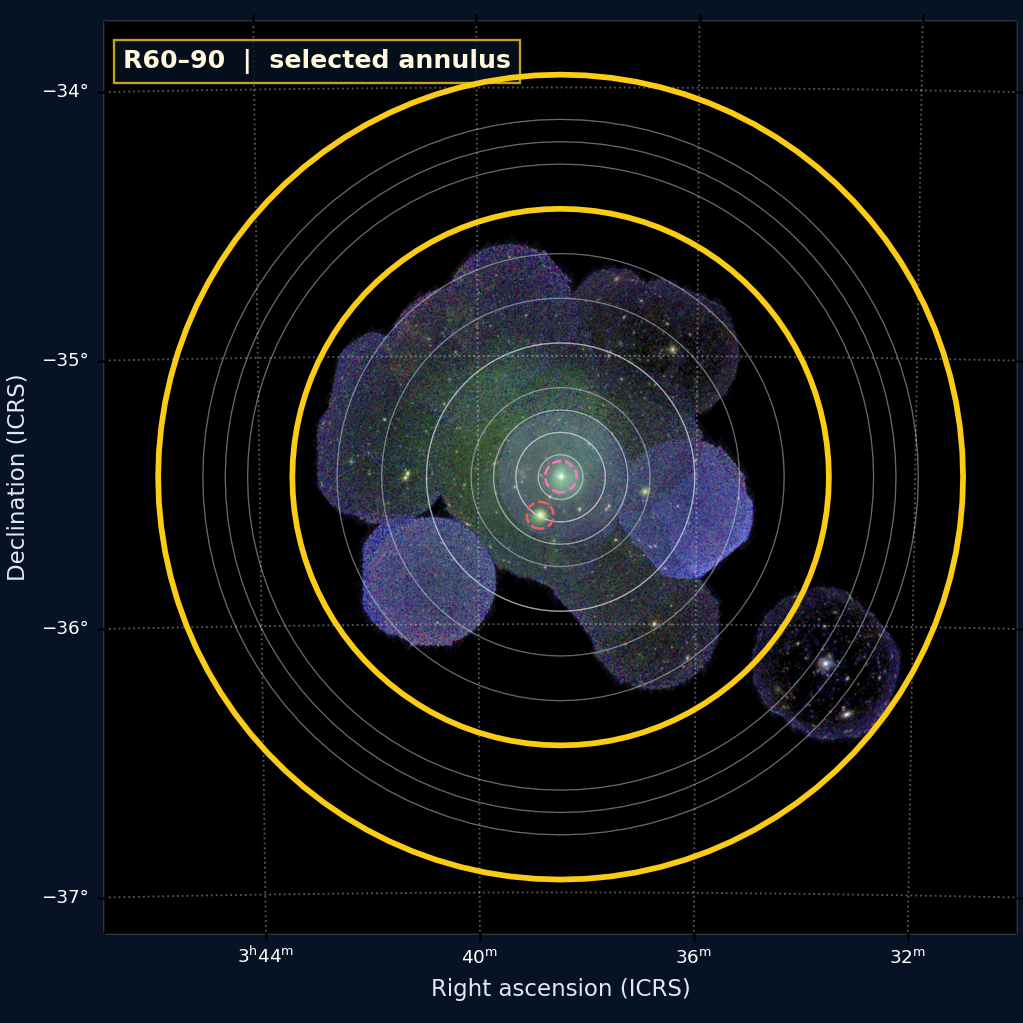
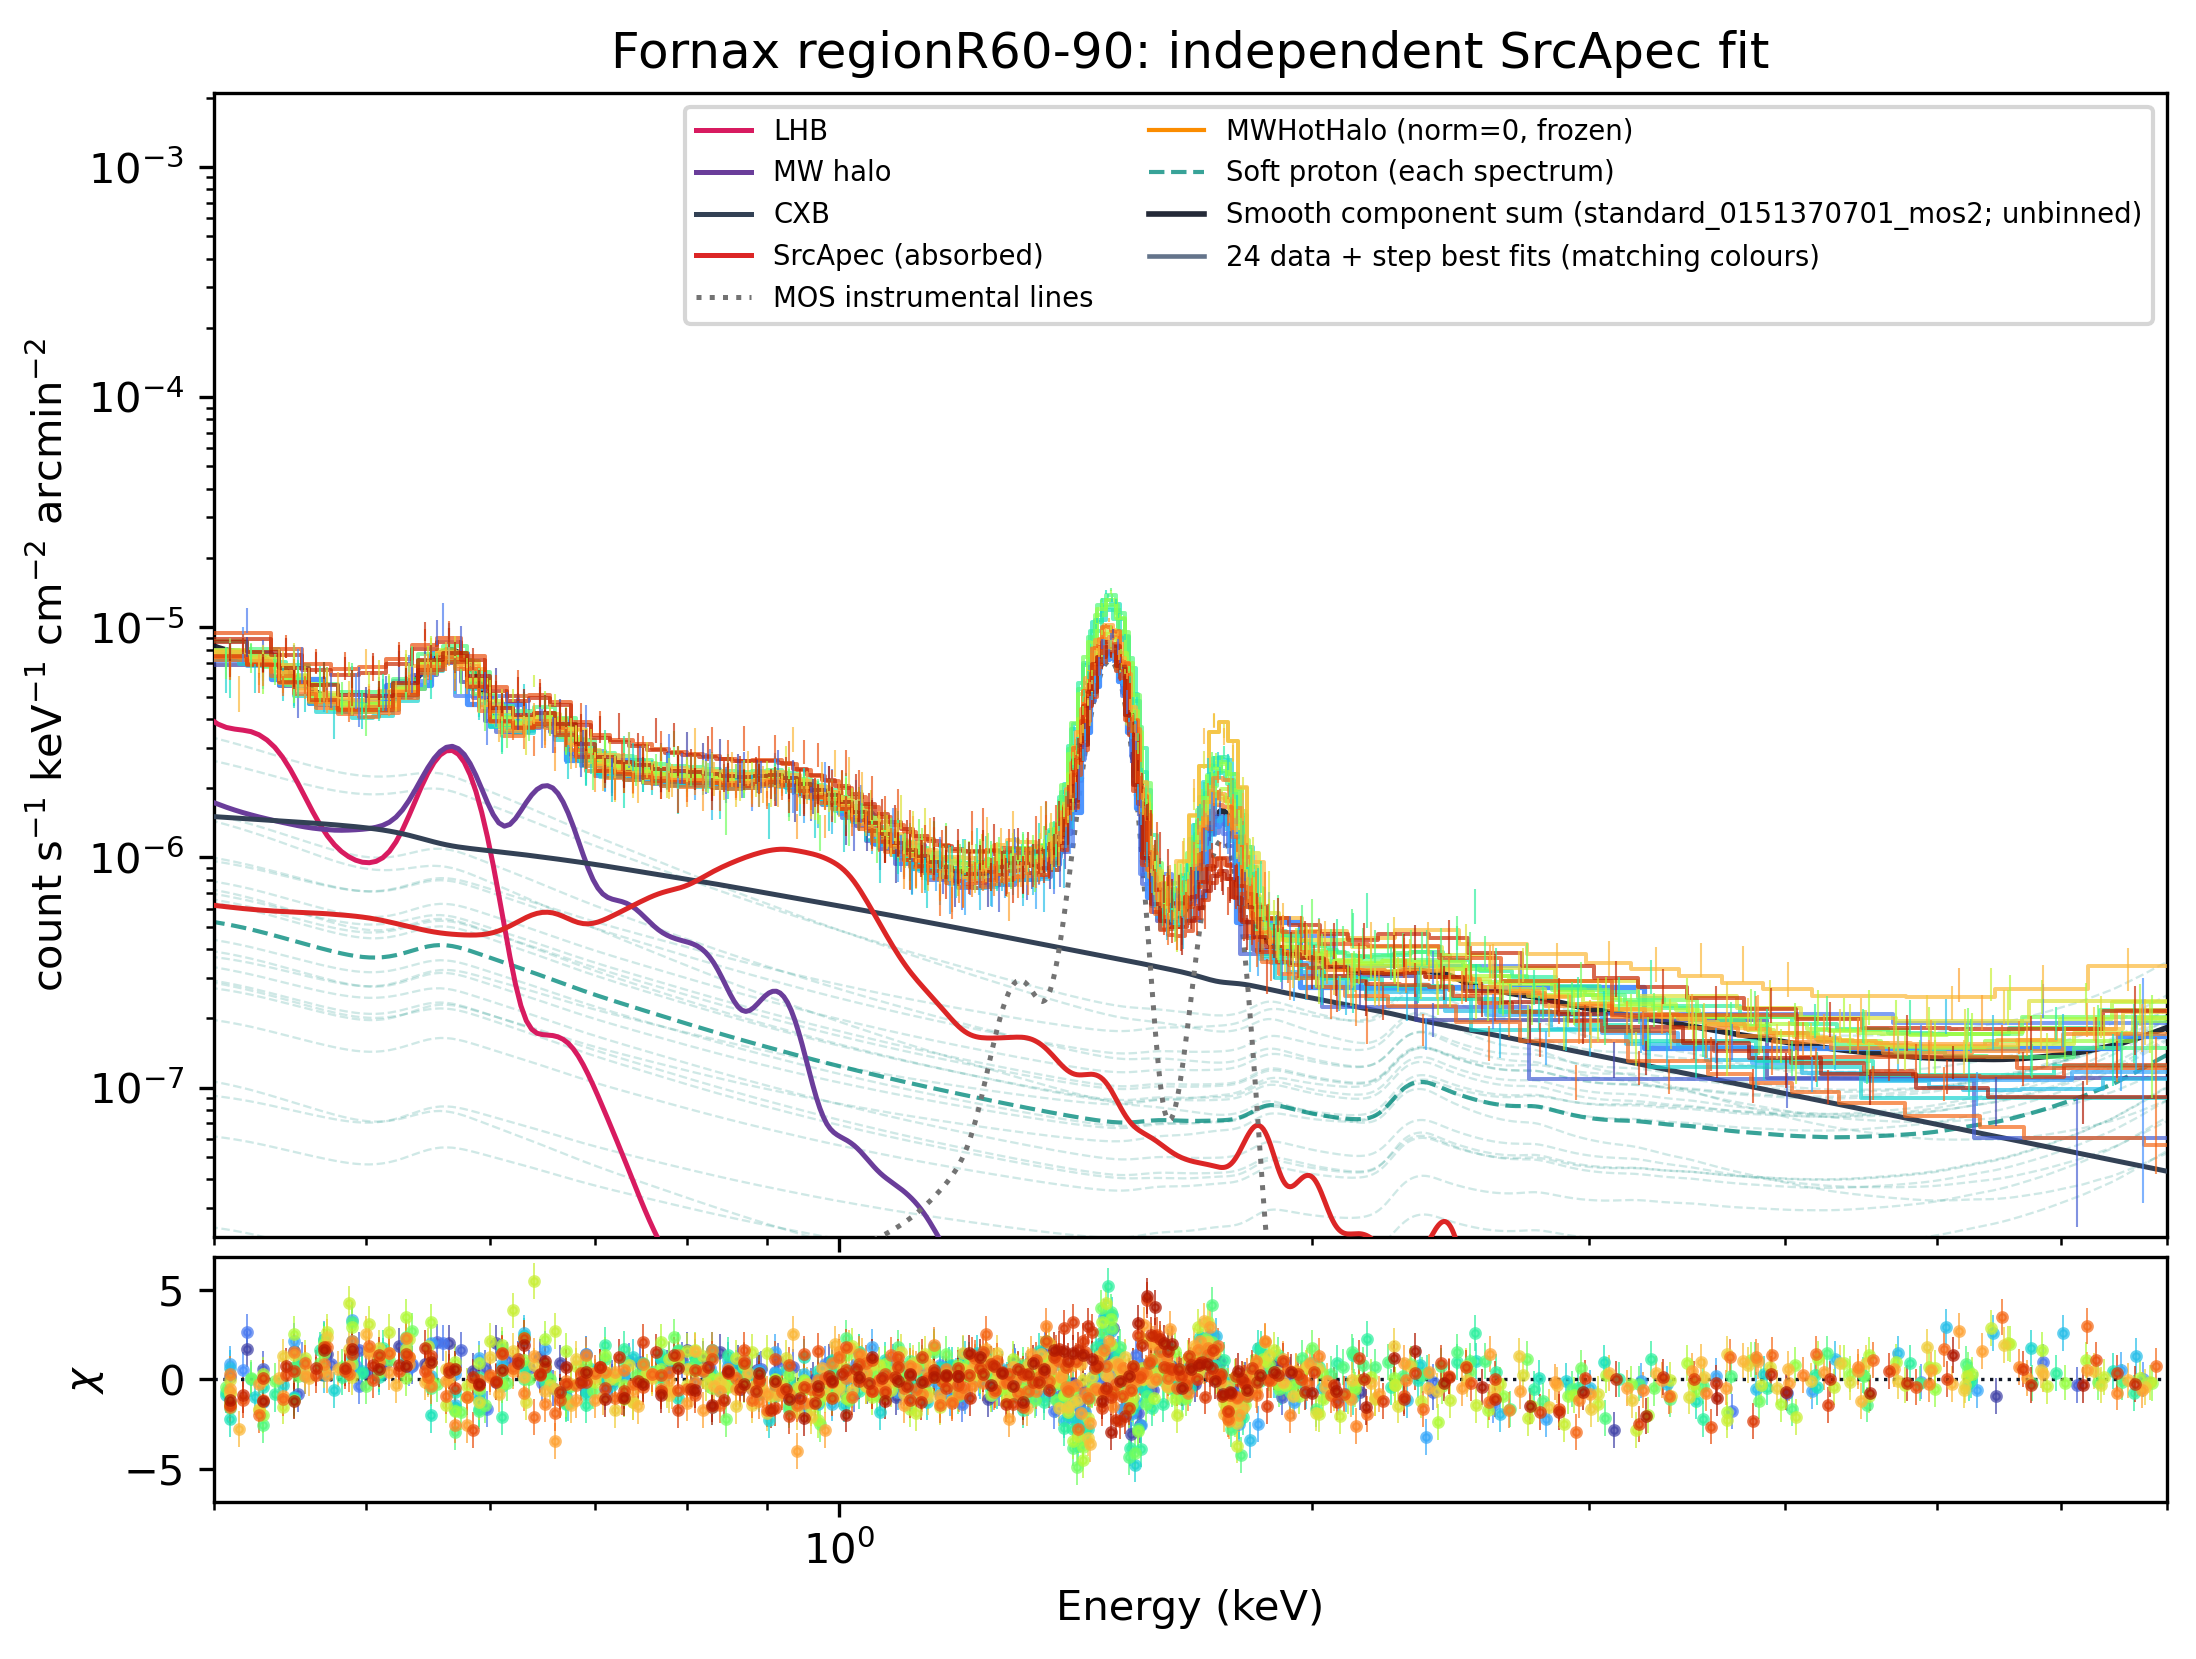
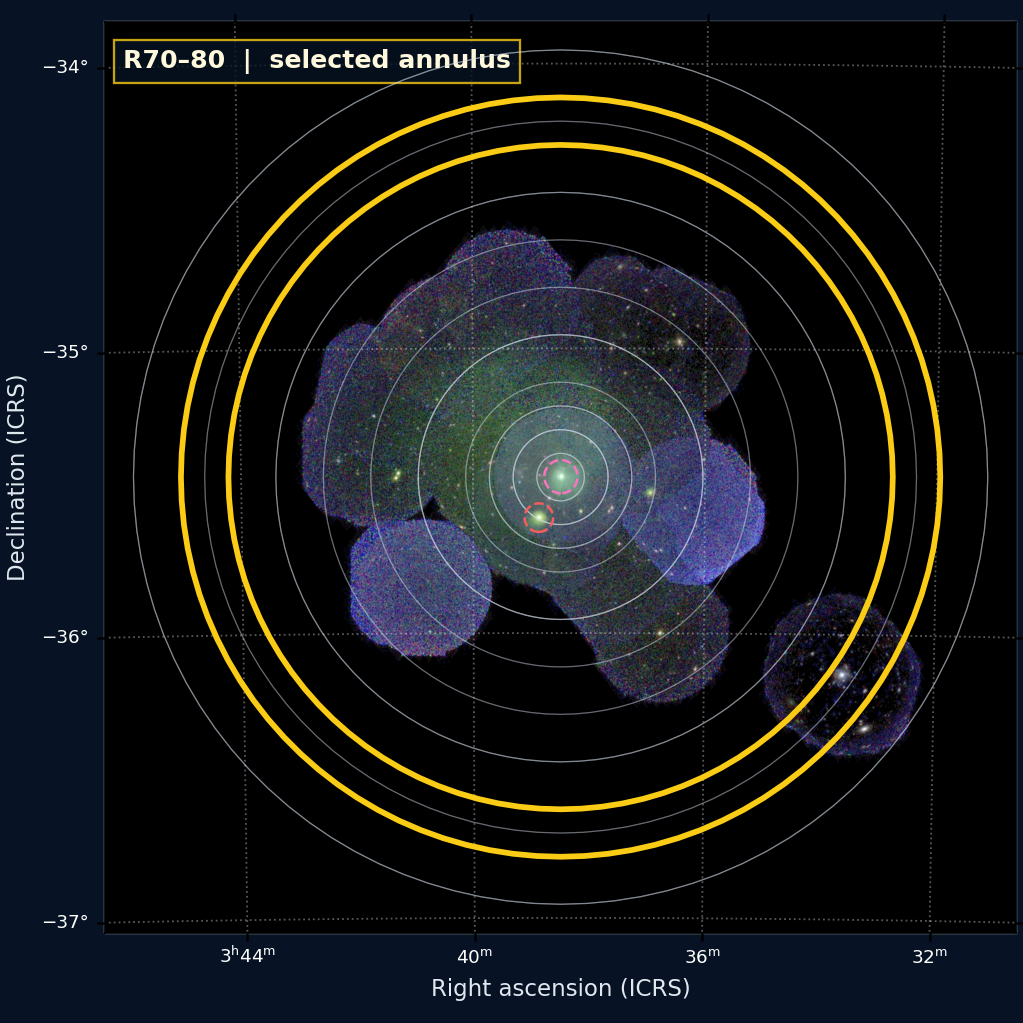
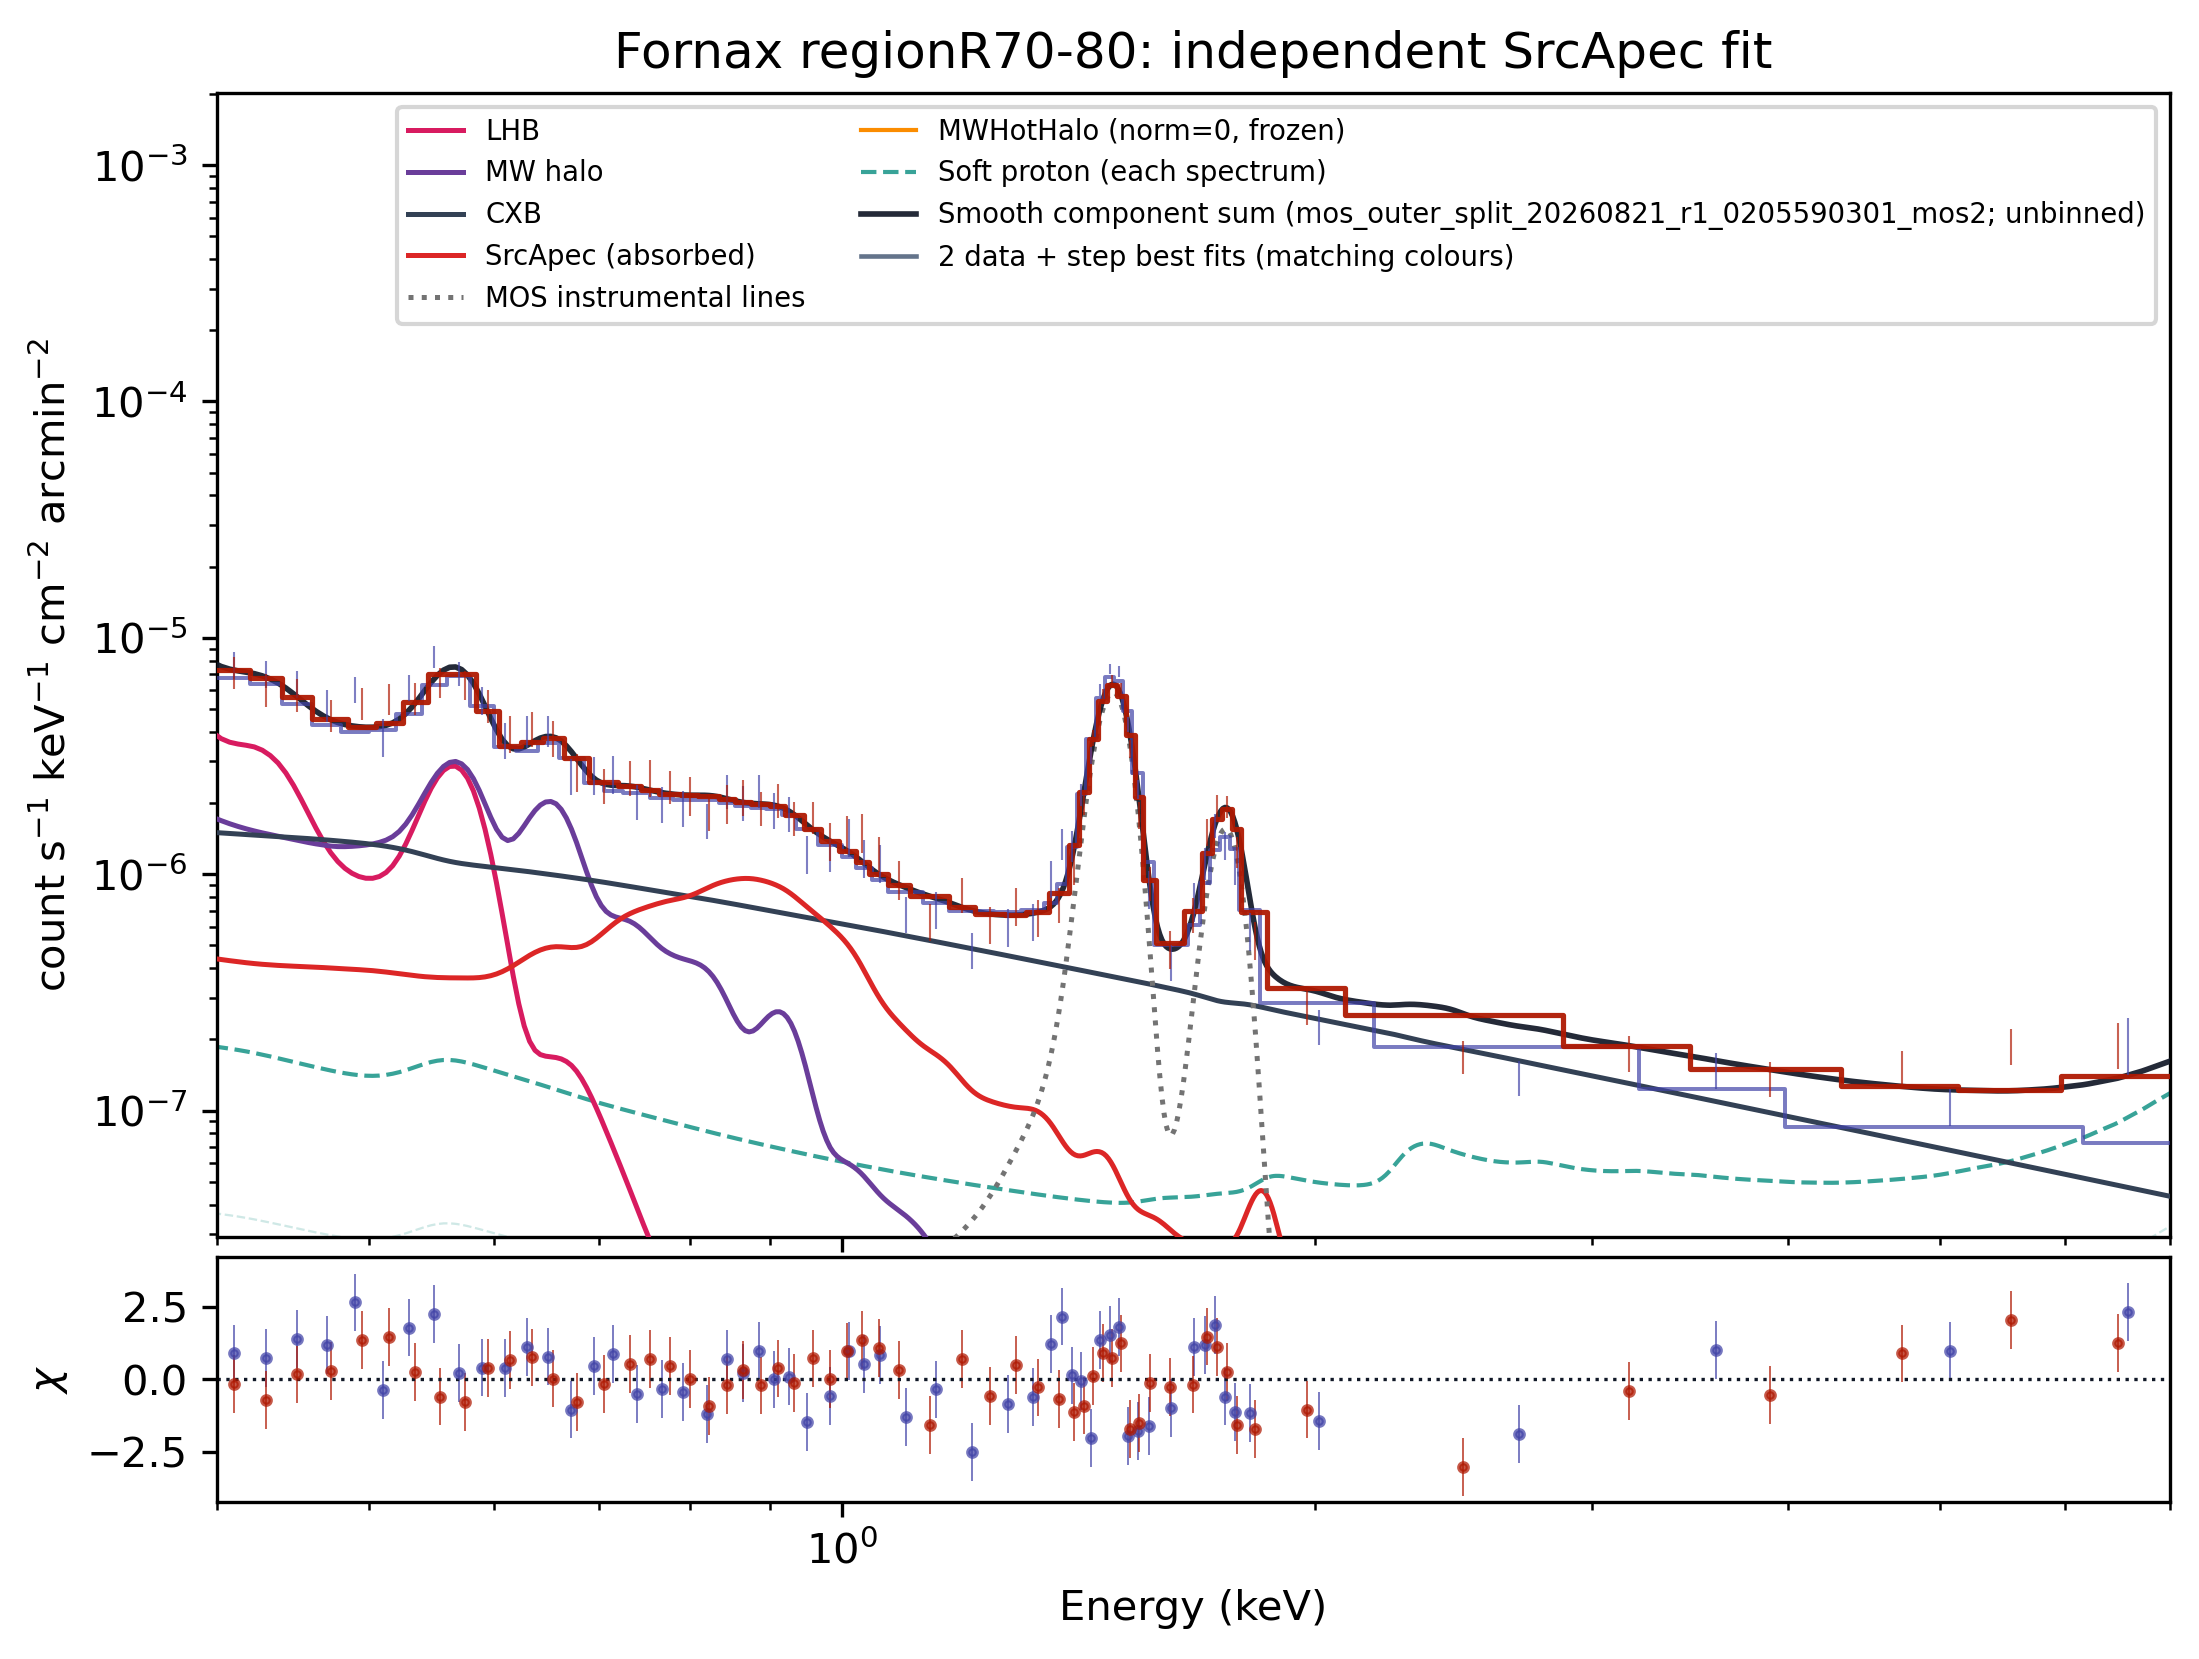
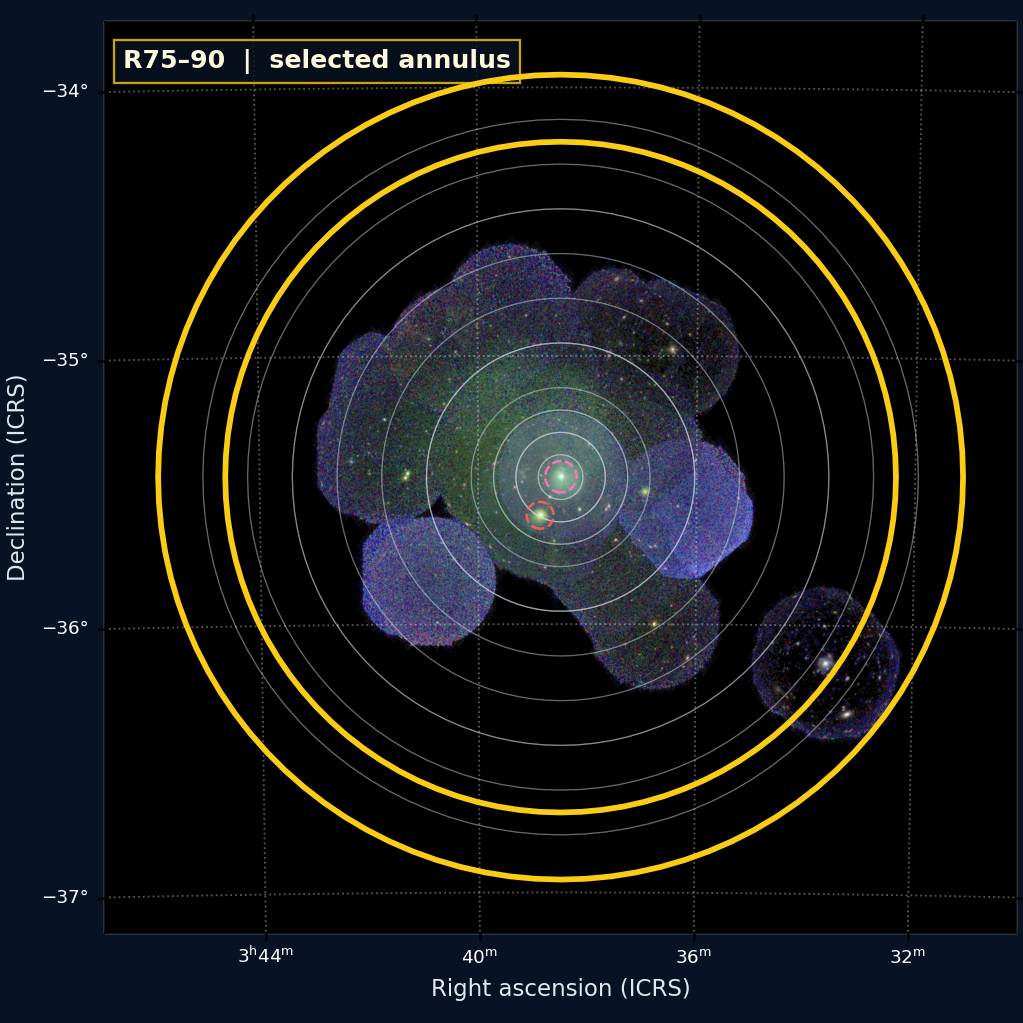
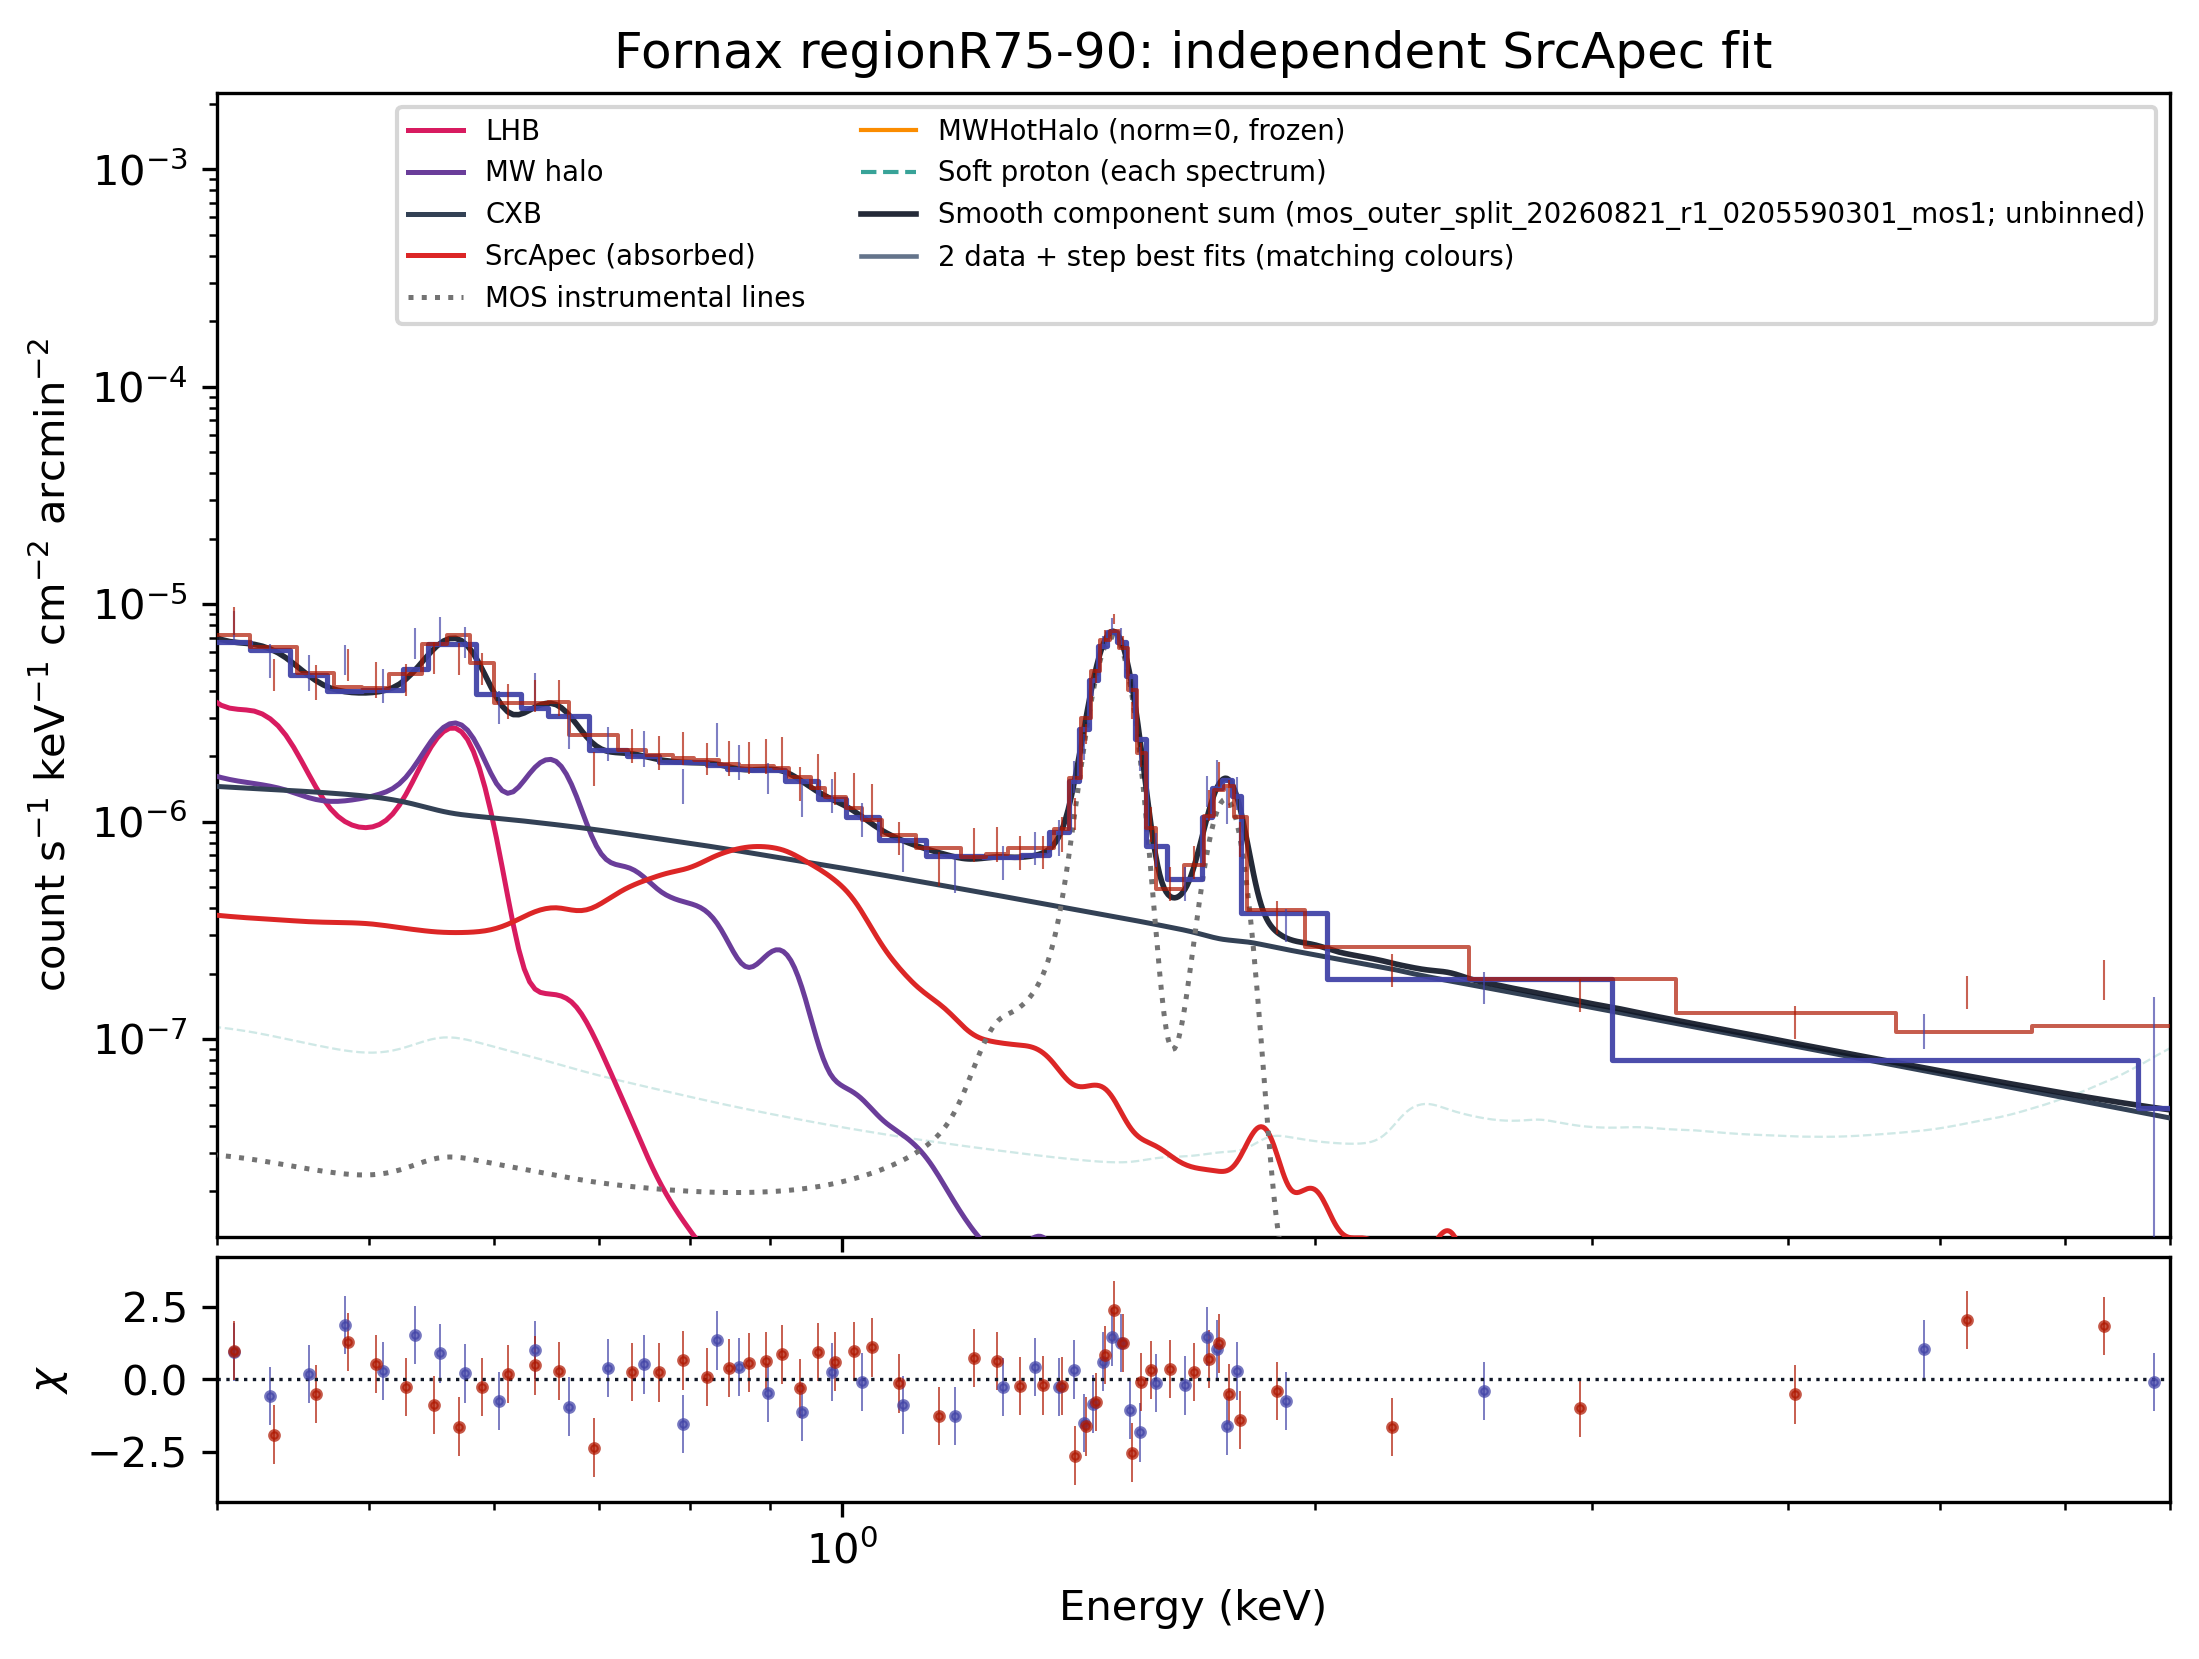
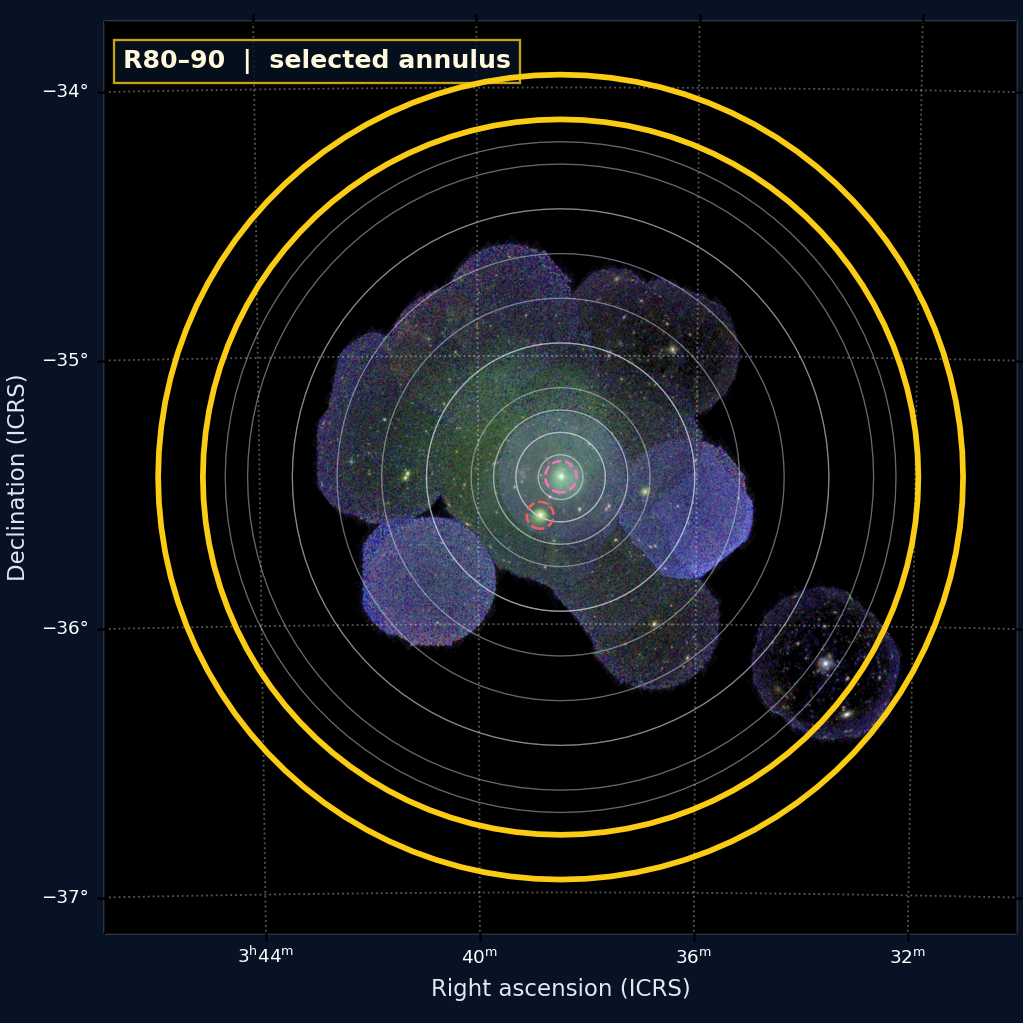
Yellow region-design maps use the real FITS WCS. Spectra are in count s⁻¹ keV⁻¹ cm⁻² arcmin⁻².

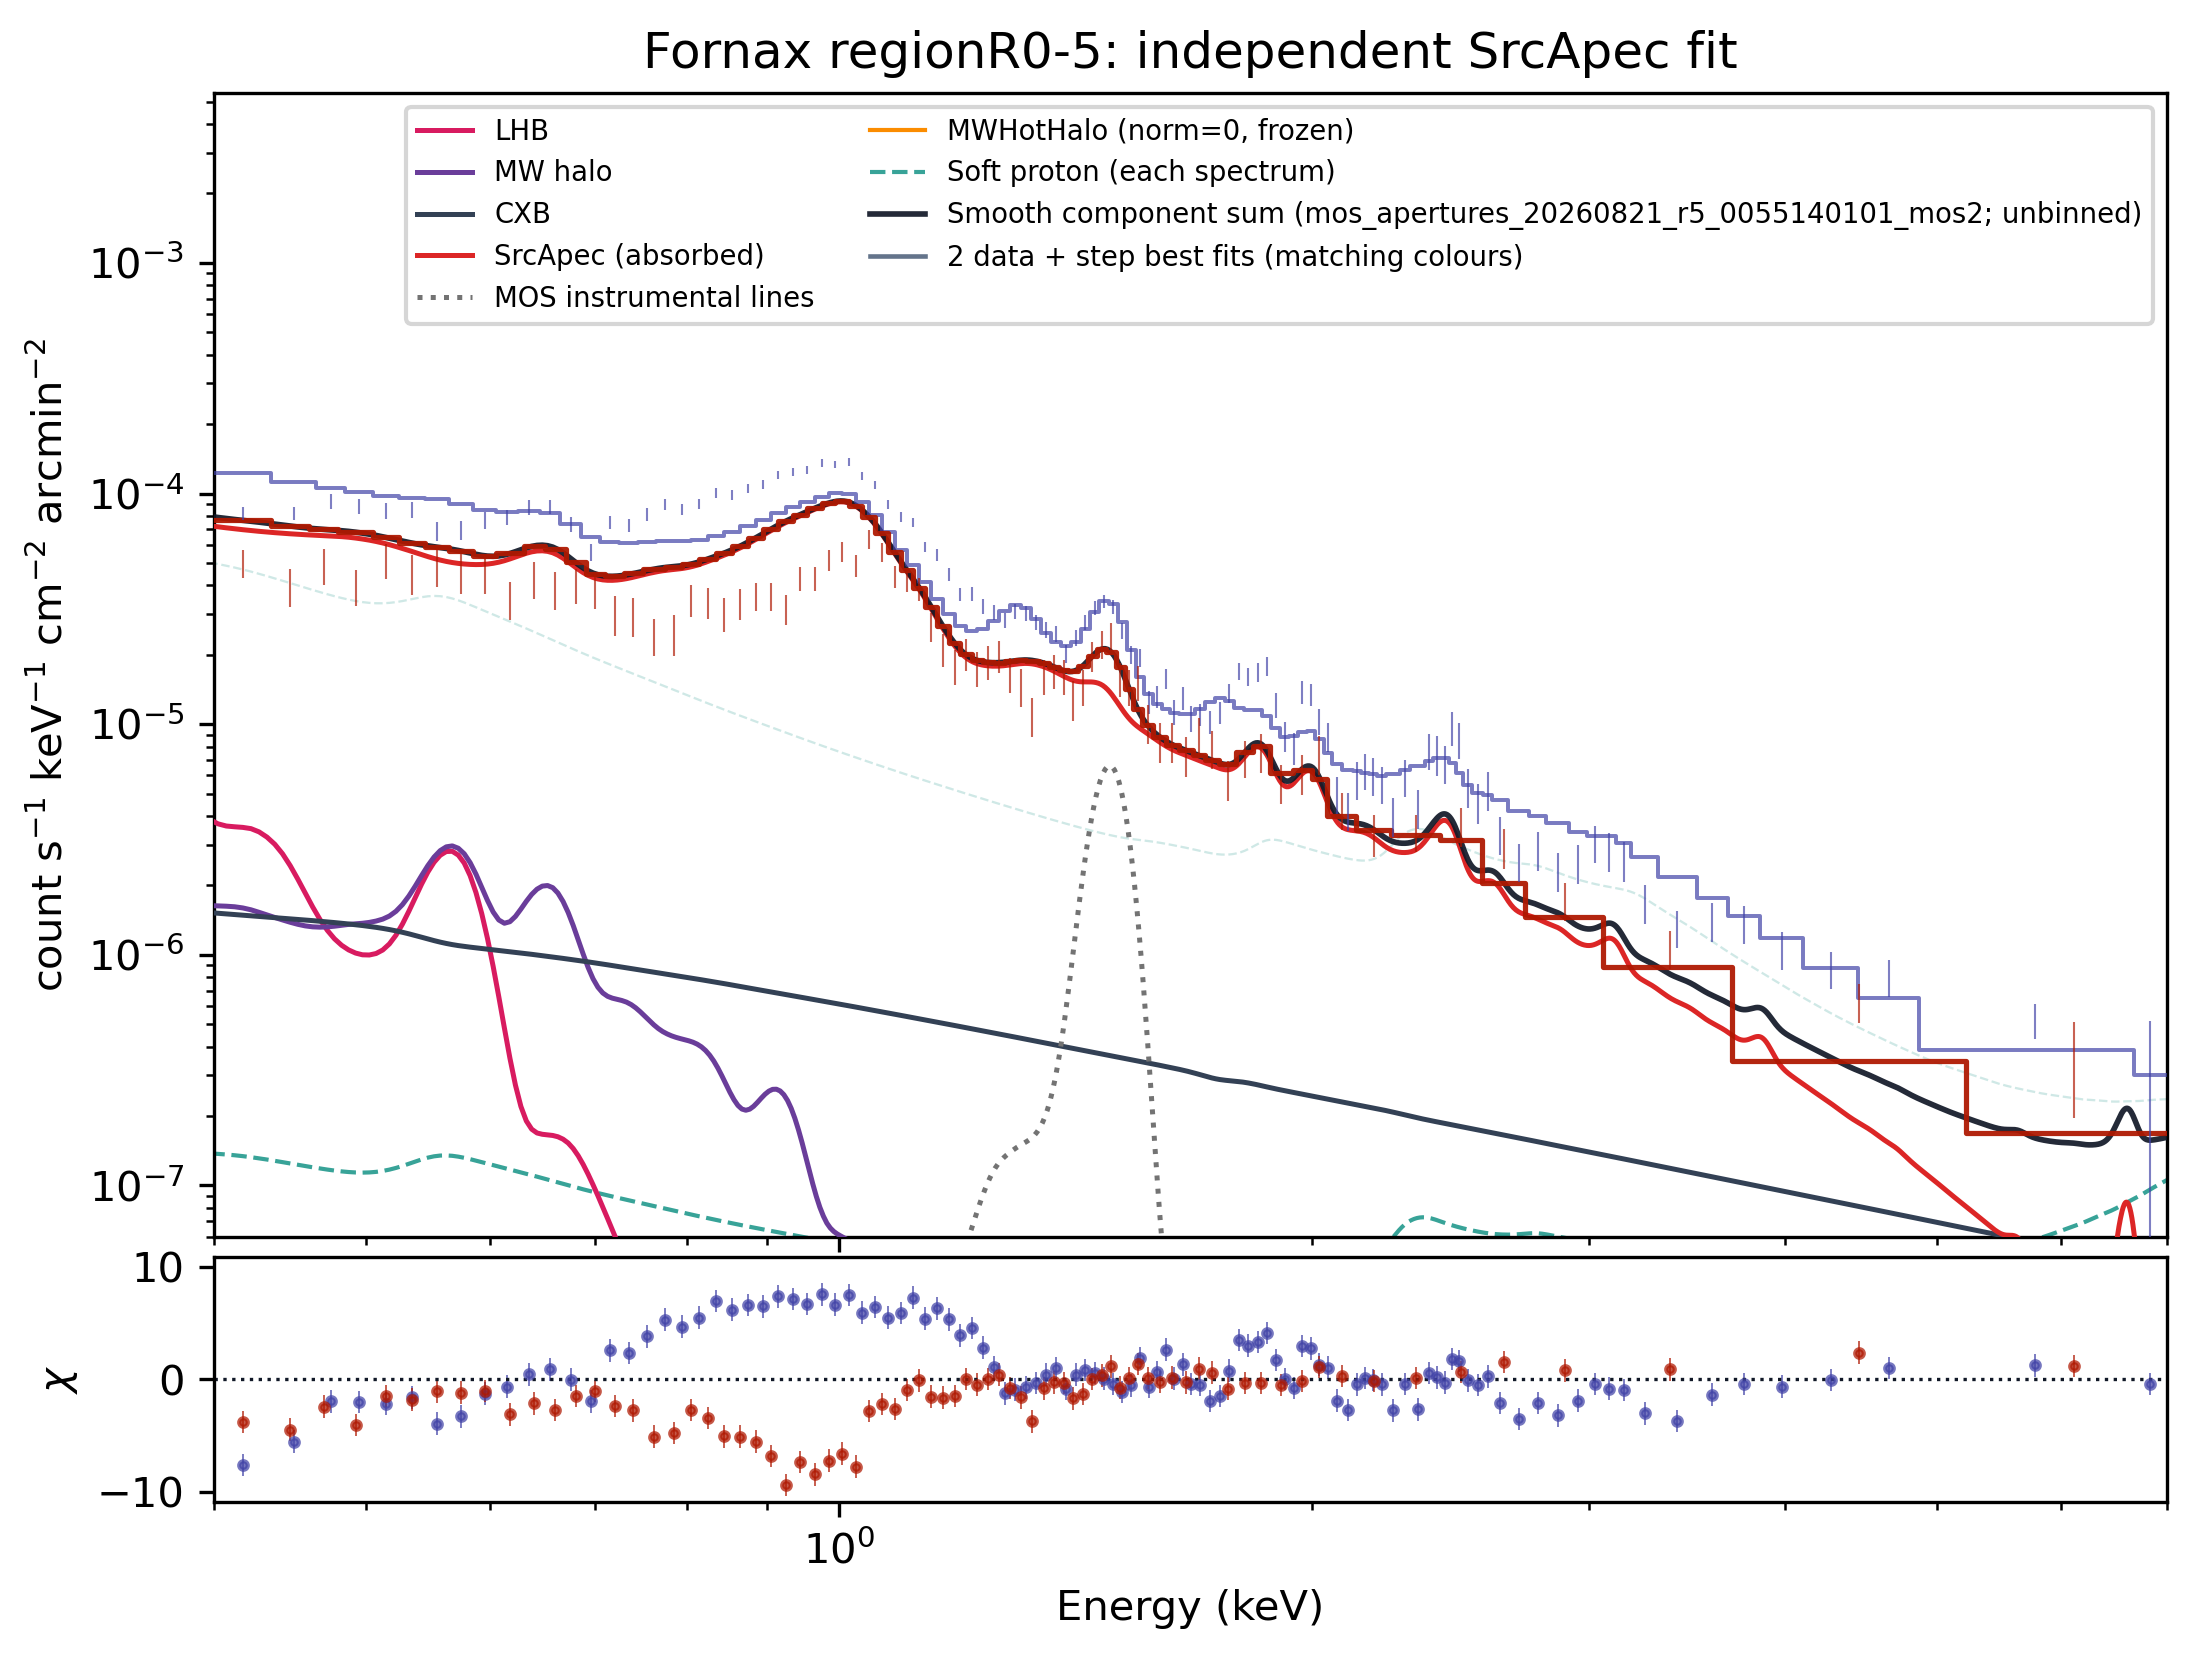
regionR0-5

R0–5

No retained MOS spectrum for the central aperture under the region-specific policy.

Legacy diagnostic fit (pre scalar-skyarea correction); not used by the current primary profile or y calculation.
Not used for current SZ
2 MOS spectra1 ObsIDskT 1.208 keVR-stat 11.39norm 2.08e-2 arcmin⁻²
Open region design and best-fit spectrum +
R0–5 on the XMM RGB WCS image
Yellow boundary:R0–5;grey marks other radial designs. Geometry source:region_mos_20260820/regionR0-5.reg。
R0–5 saved best-fit spectrum
Legacy grouped best-fit display retained as a diagnostic; its model normalization predates the scalar-skyarea correction.
ObsIDs 0055140101

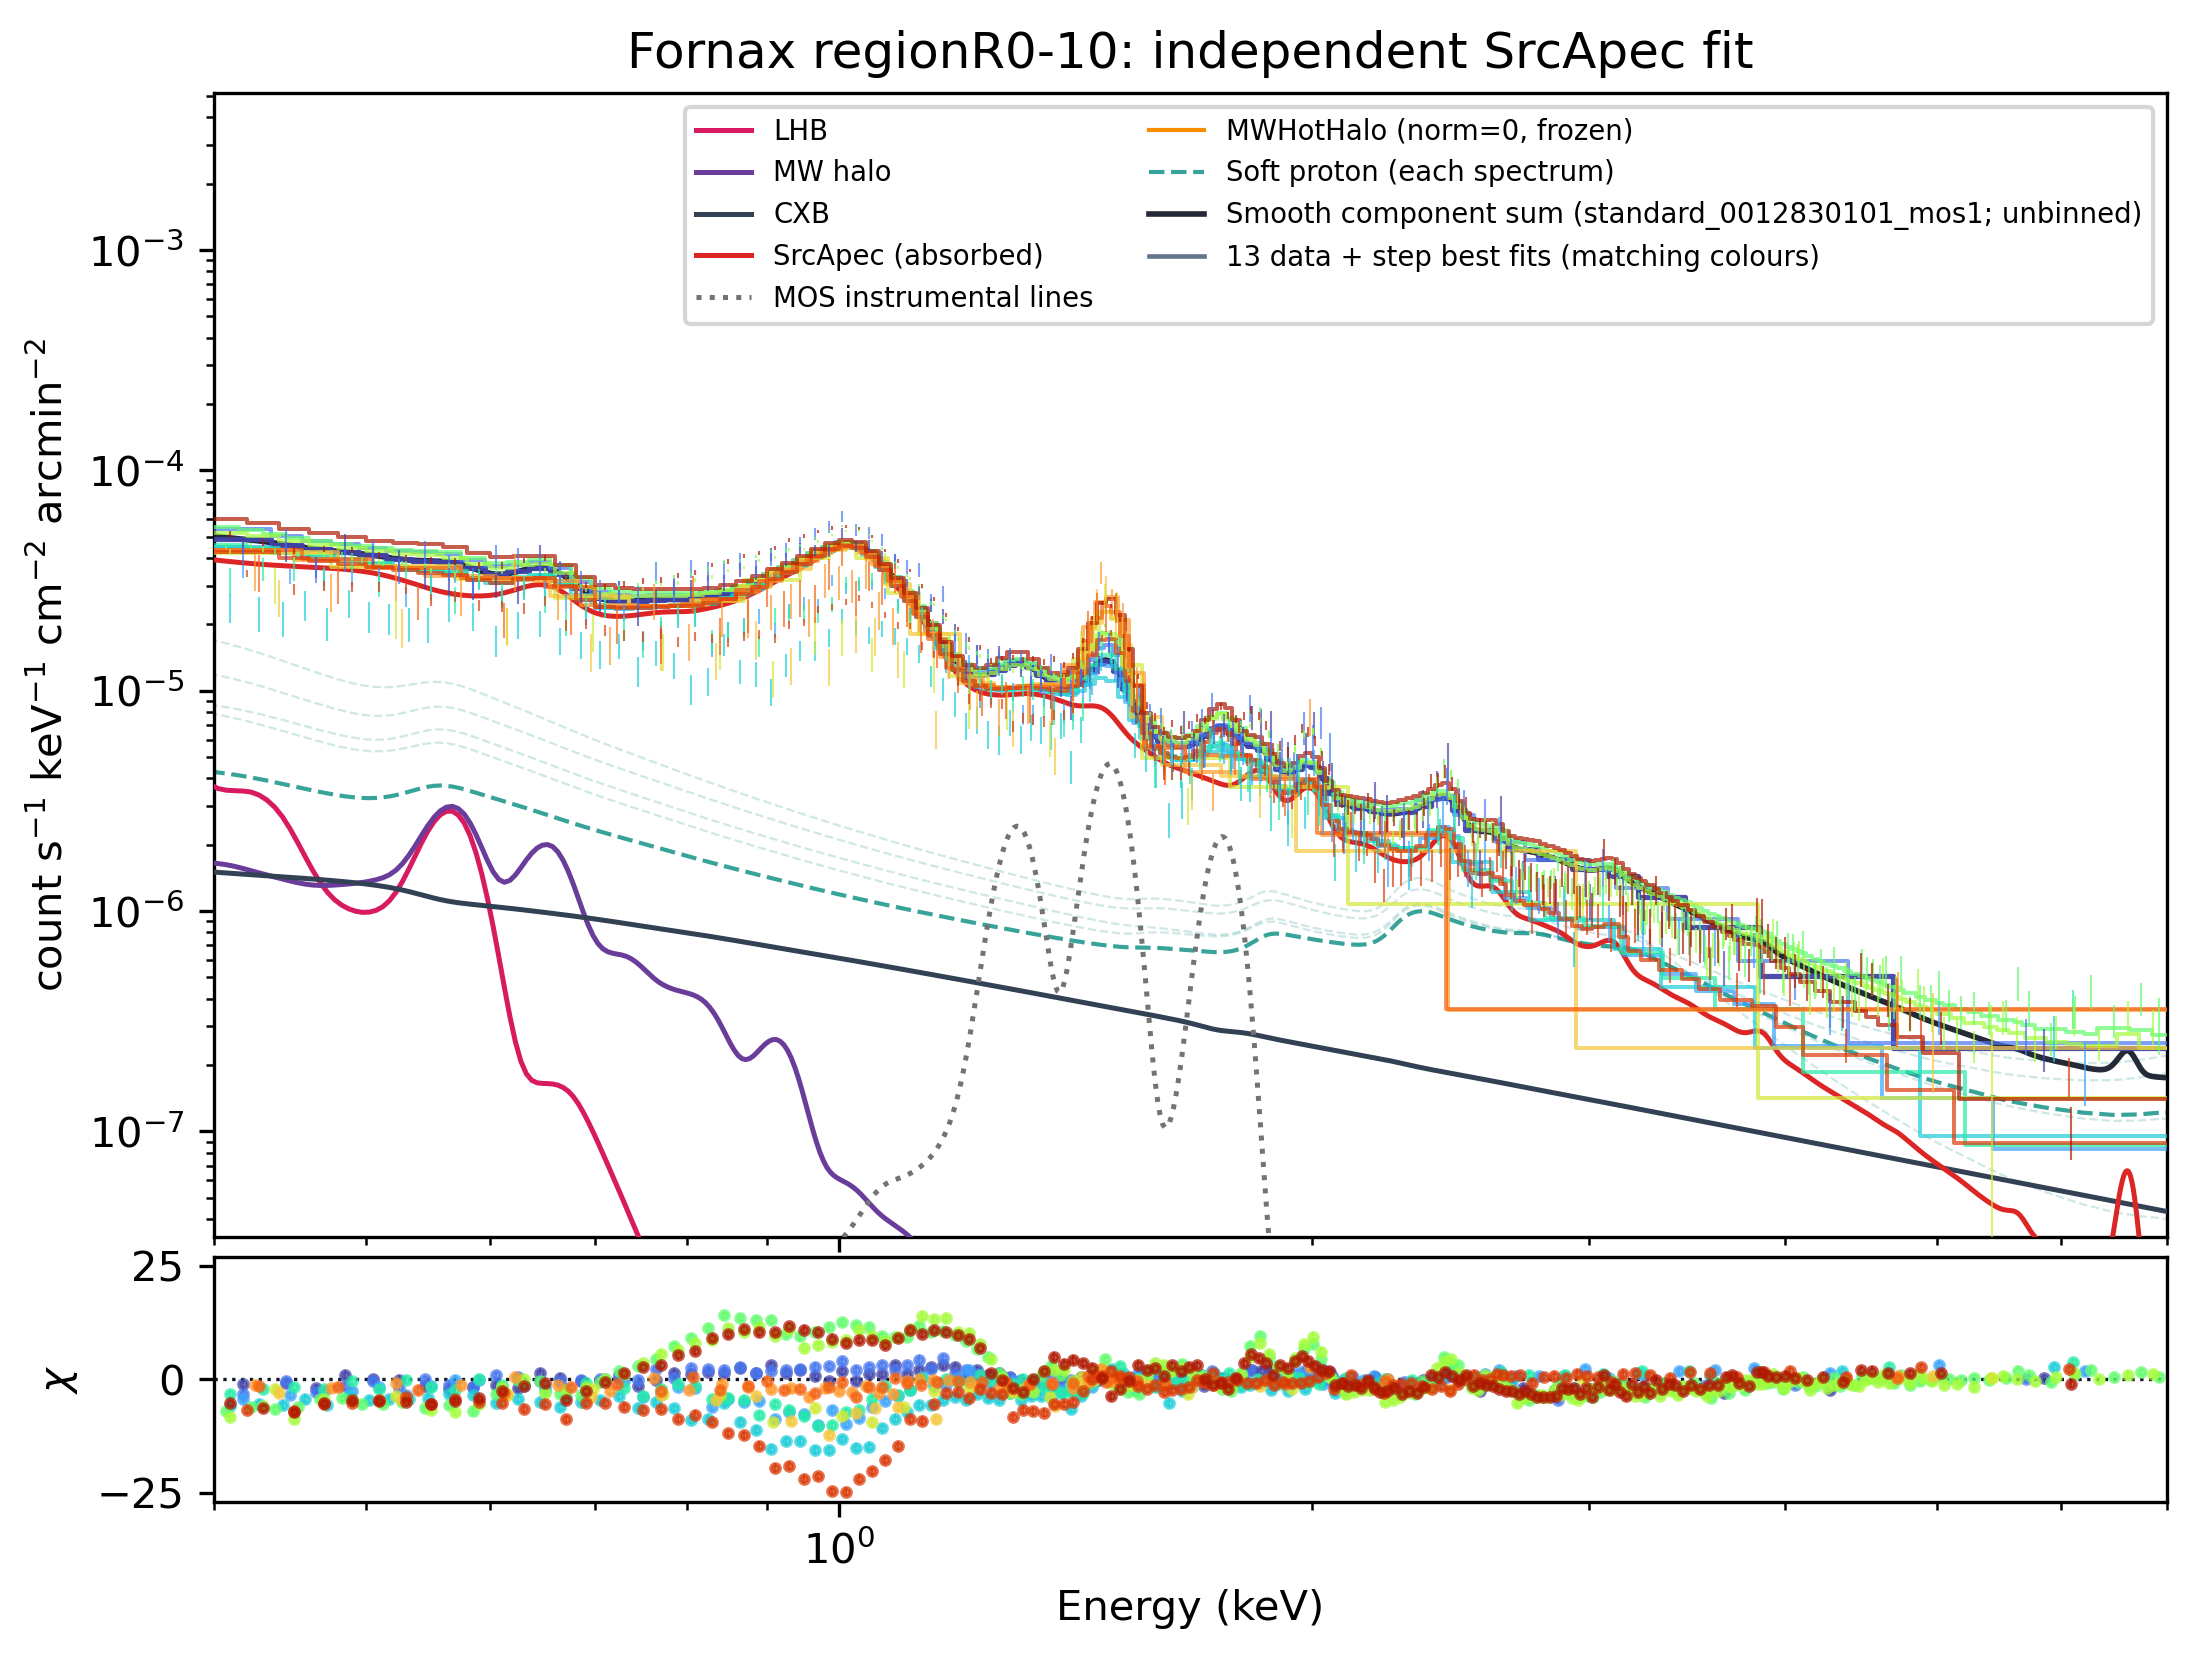
regionR0-10

R0–10

Overlaps R5–10 and includes the unavailable central aperture.

Legacy diagnostic fit (pre scalar-skyarea correction); not used by the current primary profile or y calculation.
Not used for current SZ
13 MOS spectra7 ObsIDskT 1.290 keVR-stat 20.12norm 1.16e-2 arcmin⁻²
Open region design and best-fit spectrum +
R0–10 on the XMM RGB WCS image
Yellow boundary:R0–10;grey marks other radial designs. Geometry source:reconstructed from config/project_policy.json radial contract; original DS9 file not locally synced。
R0–10 saved best-fit spectrum
Legacy grouped best-fit display retained as a diagnostic; its model normalization predates the scalar-skyarea correction.
ObsIDs 0012830101 · 0055140101 · 0304940101 · 0400620101 · 0550931001 · 0550931401 · 0781350101

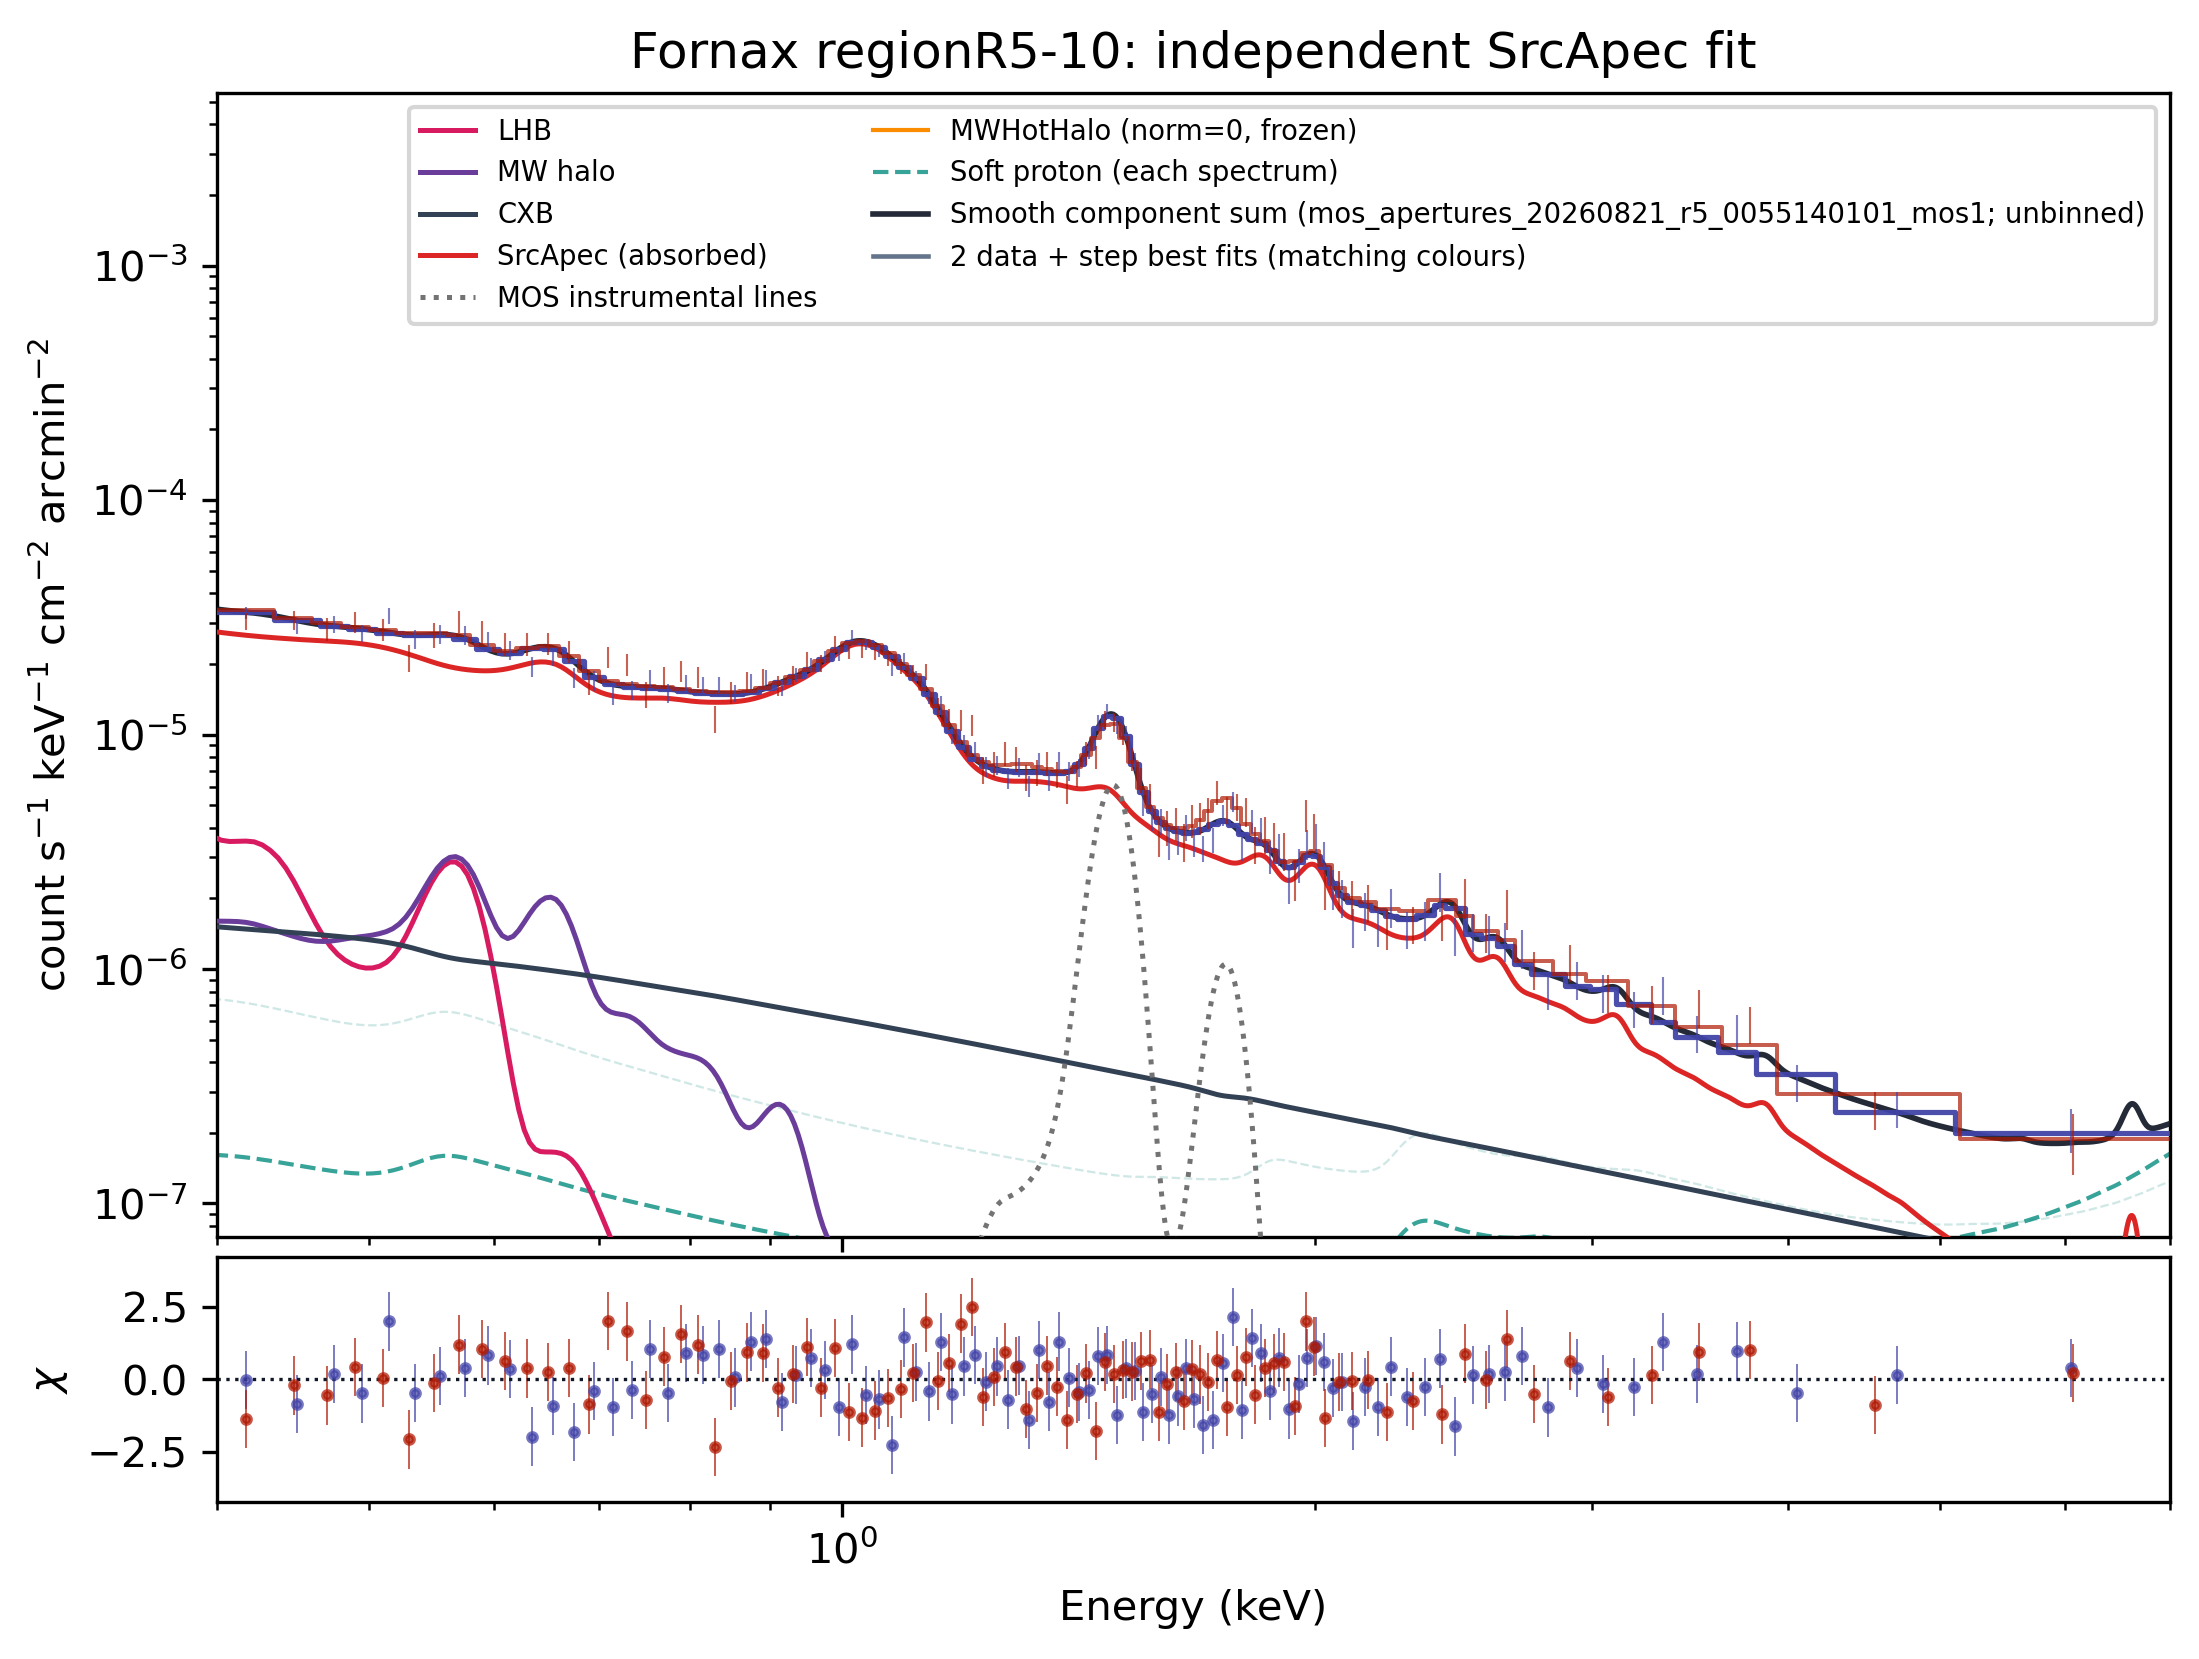
regionR5-10

R5–10

Non-overlapping primary annulus used by the preliminary y calculation.

Corrected scalar-skyarea per-ObsID annular median; displayed spread in the profile is the 16-84% cross-ObsID interval when N>1.
SZ primary
2 MOS spectra1 ObsIDskT 1.467 keVR-stat 0.90norm 4.06e-5 arcmin⁻²
Open region design and best-fit spectrum +
R5–10 on the XMM RGB WCS image
Yellow boundary:R5–10;grey marks other radial designs. Geometry source:region_mos_20260820/regionR5-10.reg。
R5–10 saved best-fit spectrum
The numeric primary-annulus summary is corrected. This legacy grouped spectrum image is retained only for visual diagnostics and is not the corrected model display.
ObsIDs 0055140101

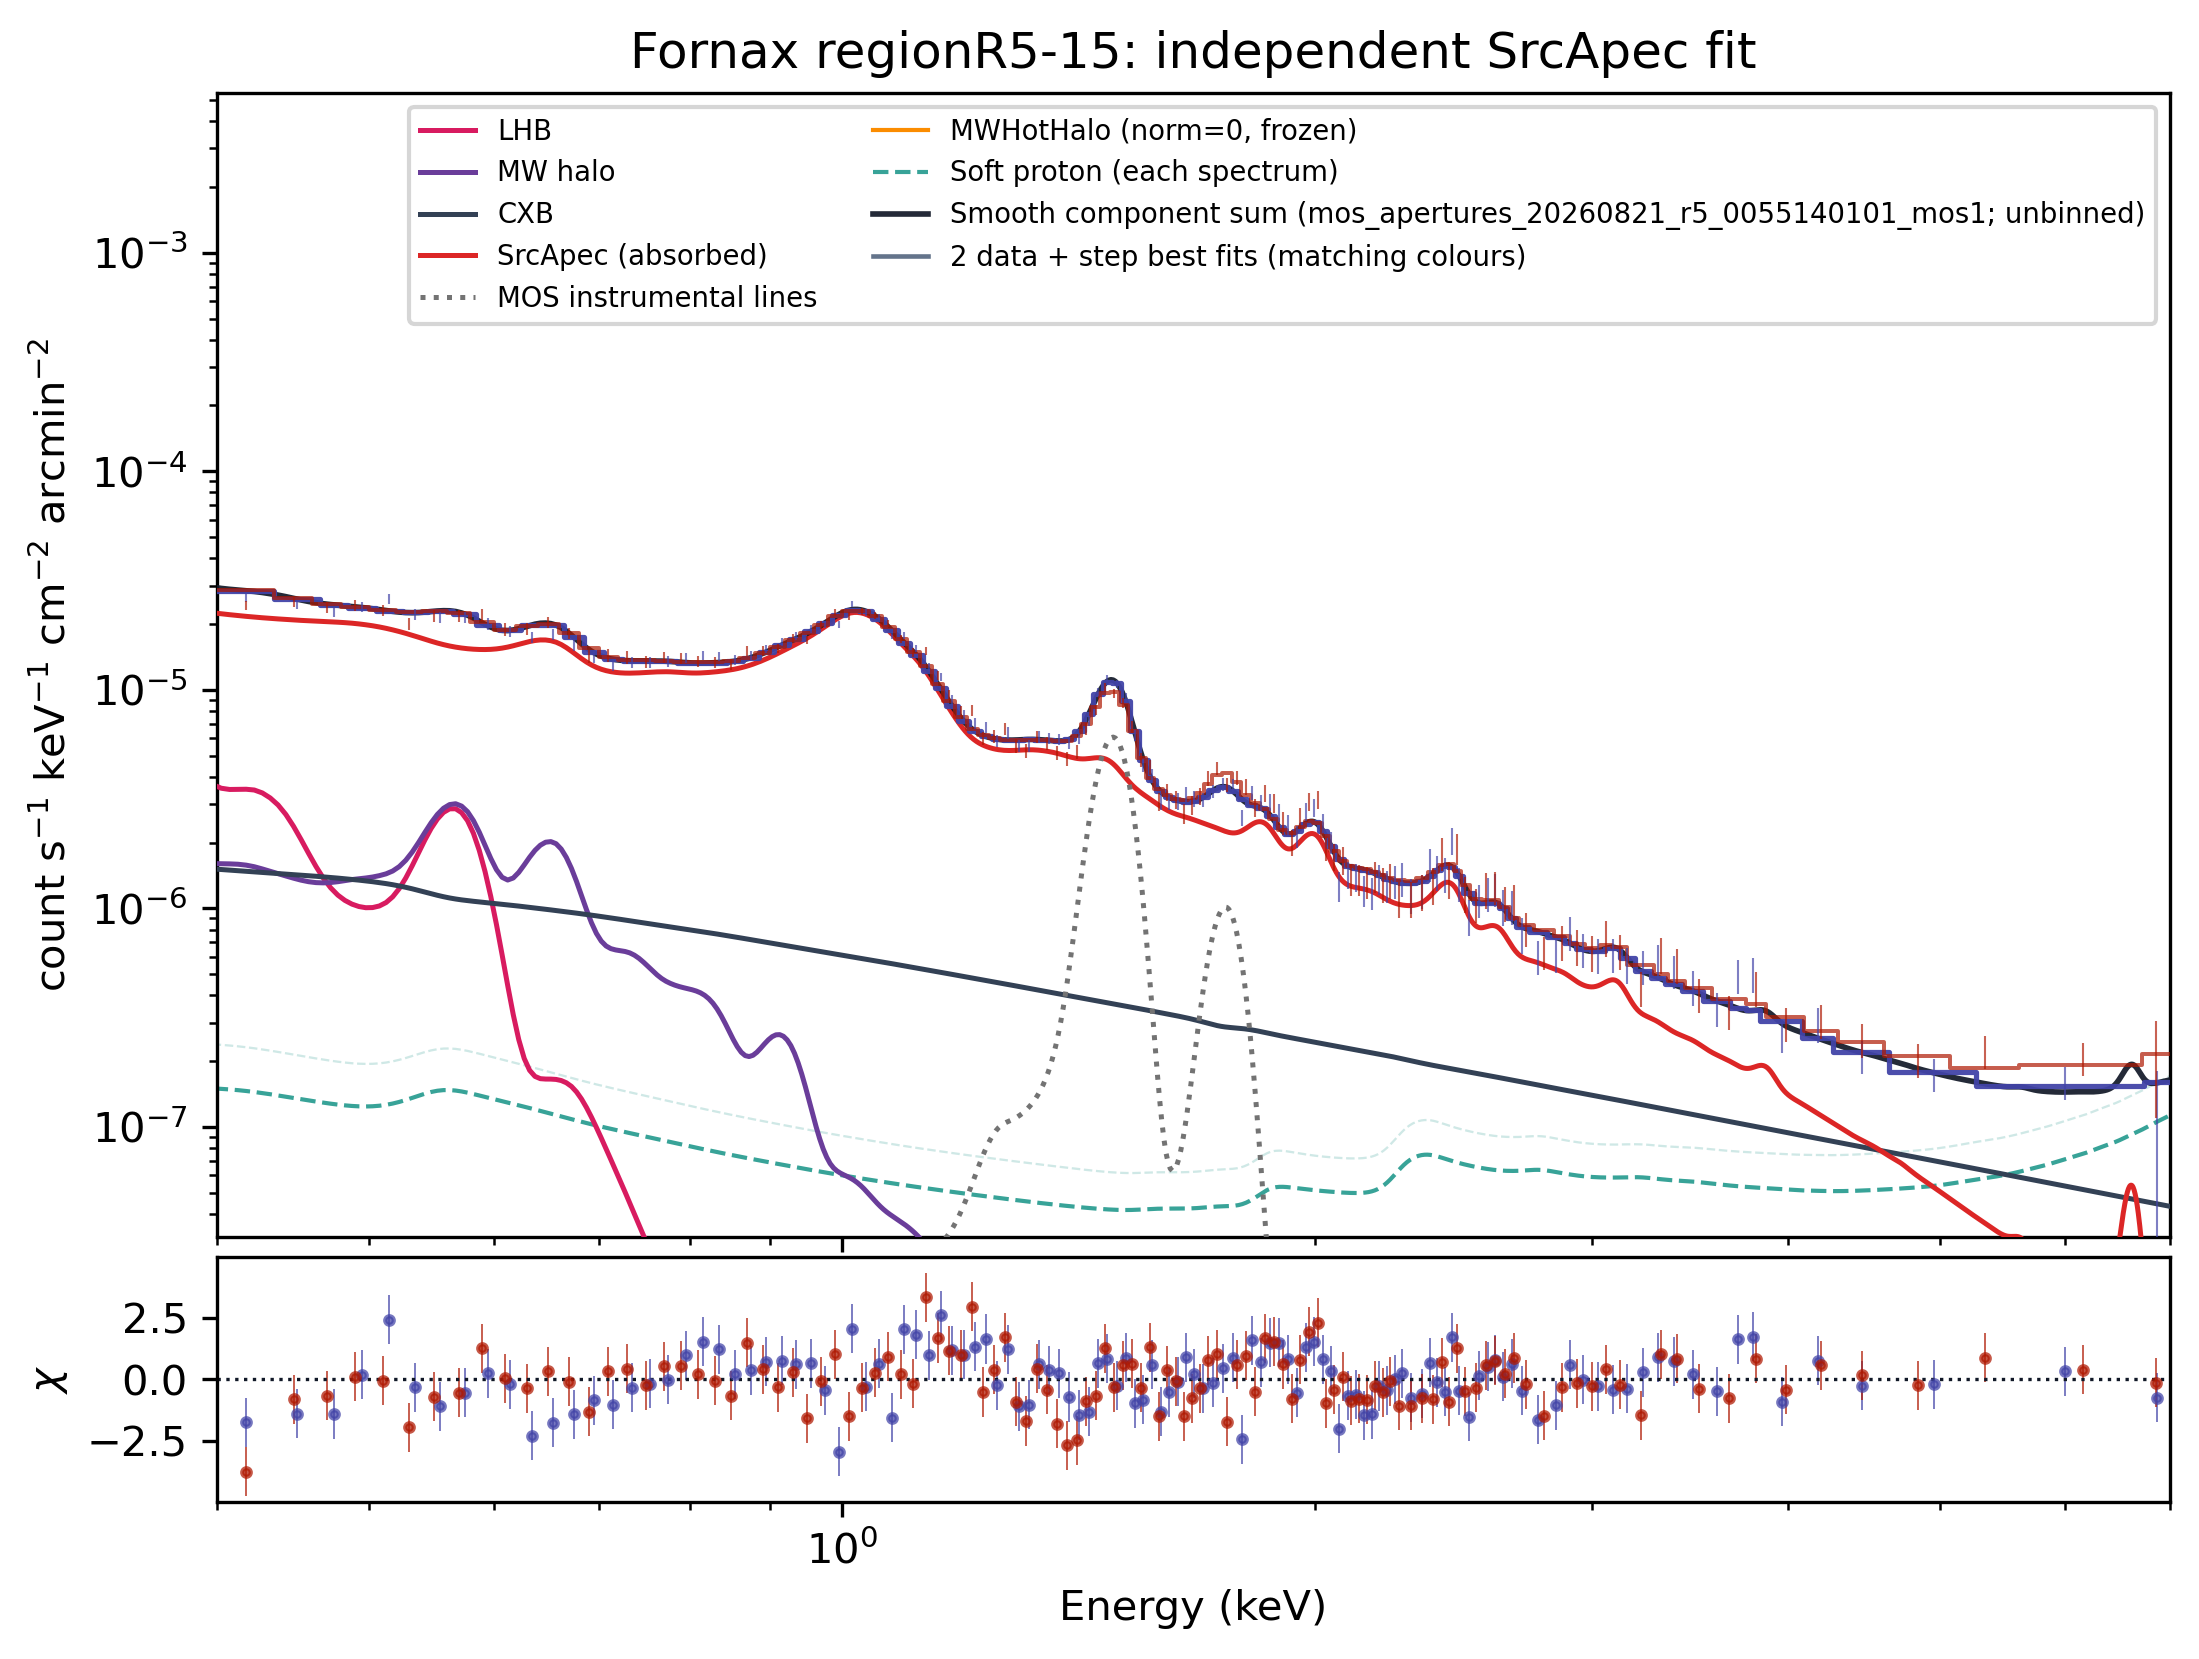
regionR5-15

R5–15

Retained for spectral/profile inspection but not used as an independent y input.

Legacy diagnostic fit (pre scalar-skyarea correction); not used by the current primary profile or y calculation.
Diagnostic overlap
2 MOS spectra1 ObsIDskT 1.376 keVR-stat 1.24norm 6.61e-3 arcmin⁻²
Open region design and best-fit spectrum +
R5–15 on the XMM RGB WCS image
Yellow boundary:R5–15;grey marks other radial designs. Geometry source:region_mos_20260820/regionR5-15.reg。
R5–15 saved best-fit spectrum
Legacy grouped best-fit display retained as a diagnostic; its model normalization predates the scalar-skyarea correction.
ObsIDs 0055140101

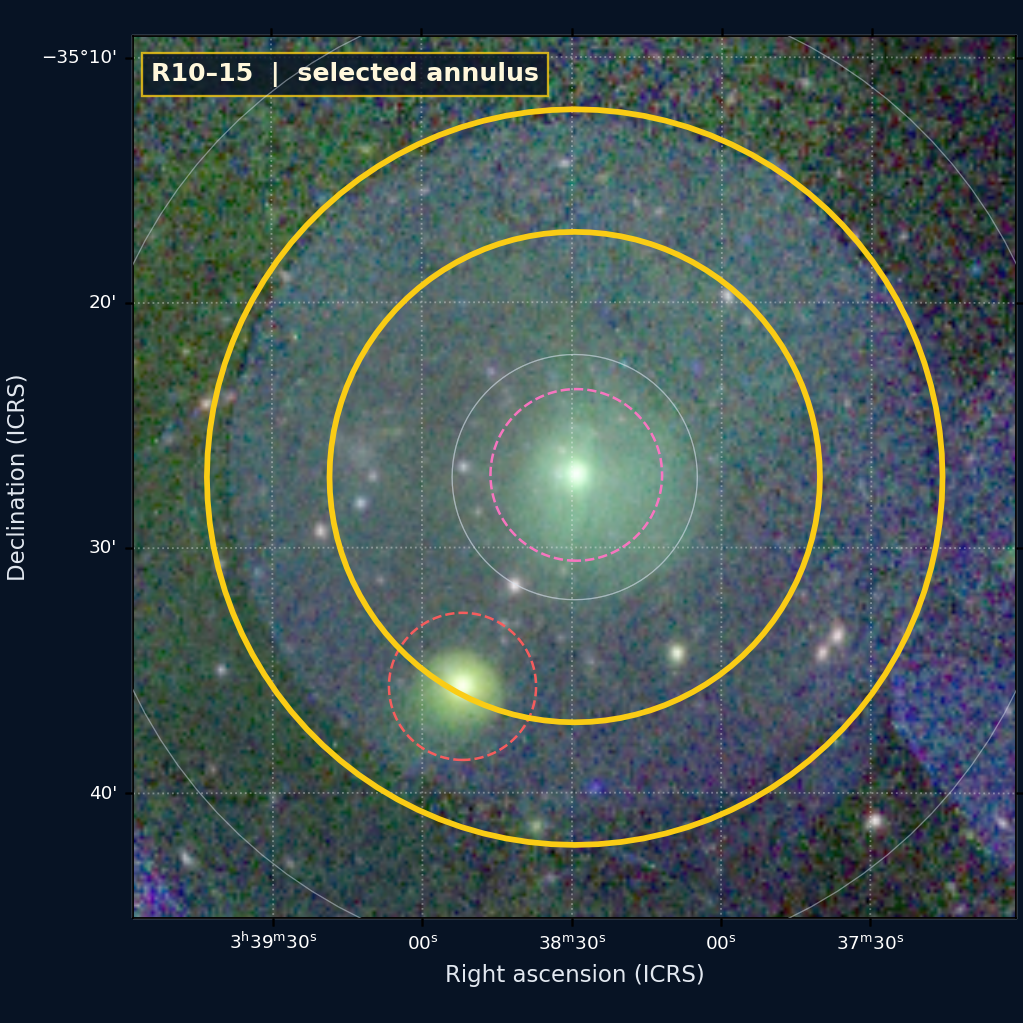
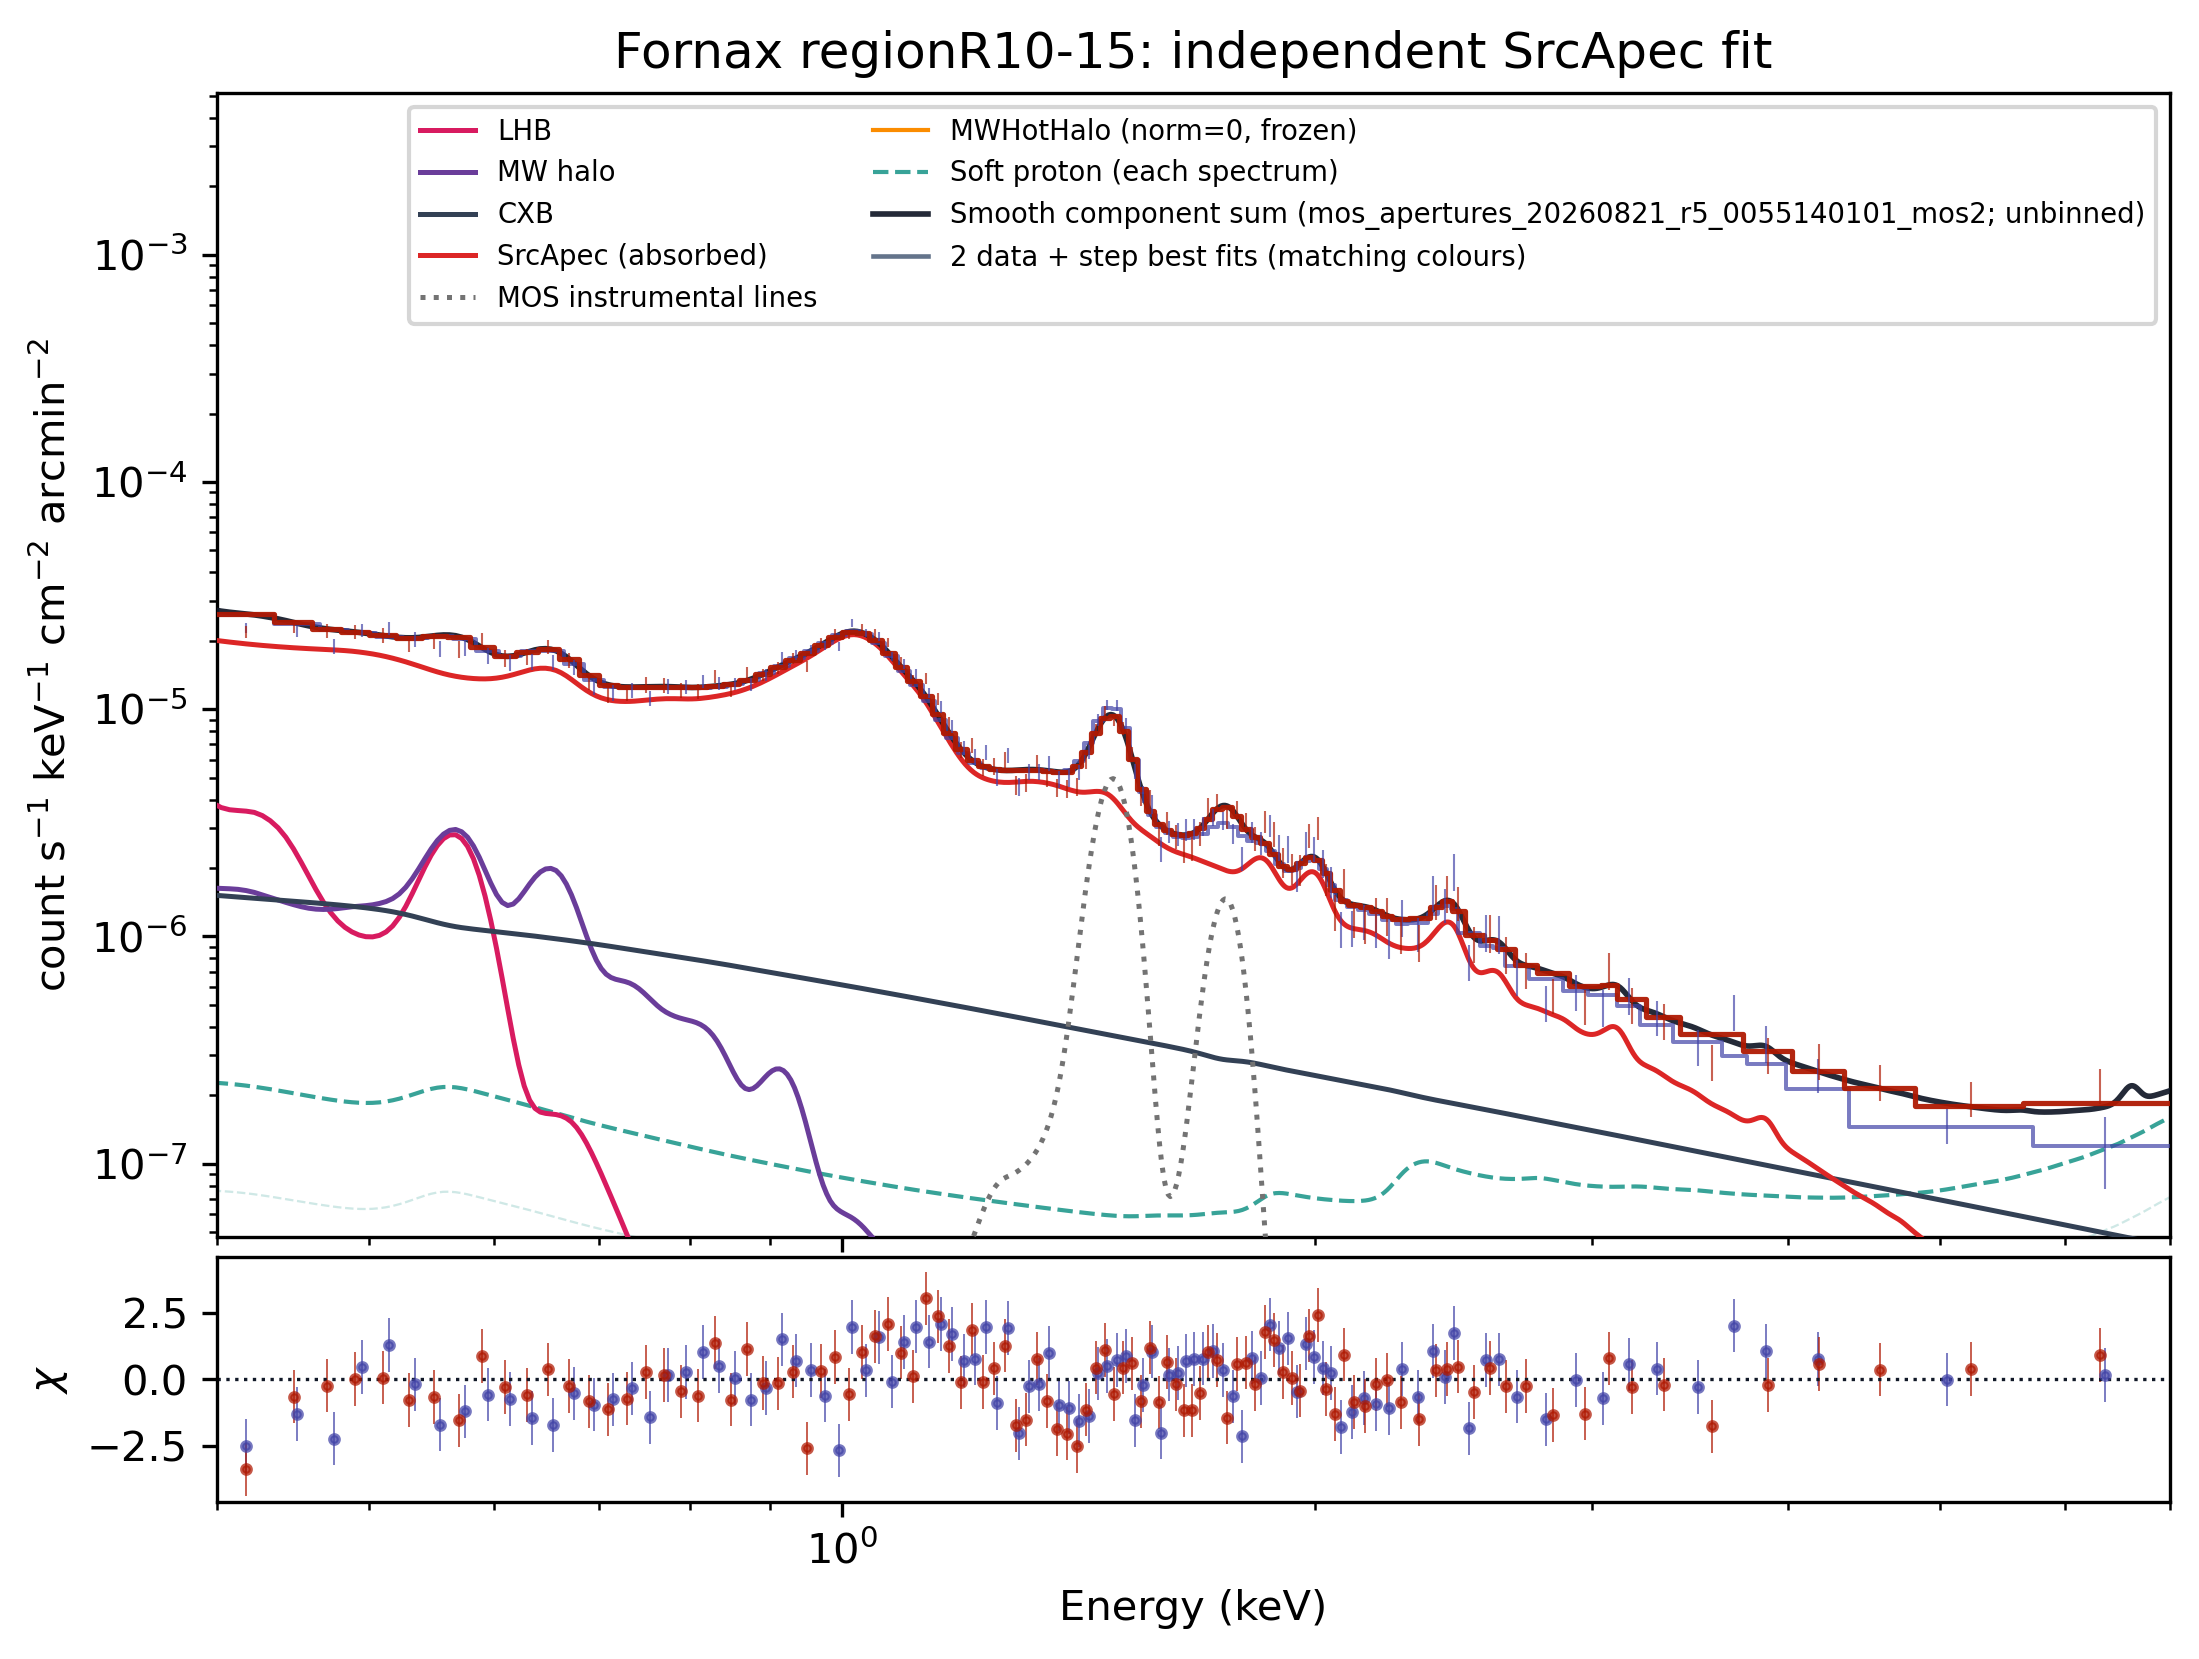
regionR10-15

R10–15

Retained for spectral/profile inspection but not used as an independent y input.

Legacy diagnostic fit (pre scalar-skyarea correction); not used by the current primary profile or y calculation.
Diagnostic overlap
2 MOS spectra1 ObsIDskT 1.337 keVR-stat 1.37norm 5.87e-3 arcmin⁻²
Open region design and best-fit spectrum +
R10–15 on the XMM RGB WCS image
Yellow boundary:R10–15;grey marks other radial designs. Geometry source:region_mos_20260820/regionR10-15.reg。
R10–15 saved best-fit spectrum
Legacy grouped best-fit display retained as a diagnostic; its model normalization predates the scalar-skyarea correction.
ObsIDs 0055140101

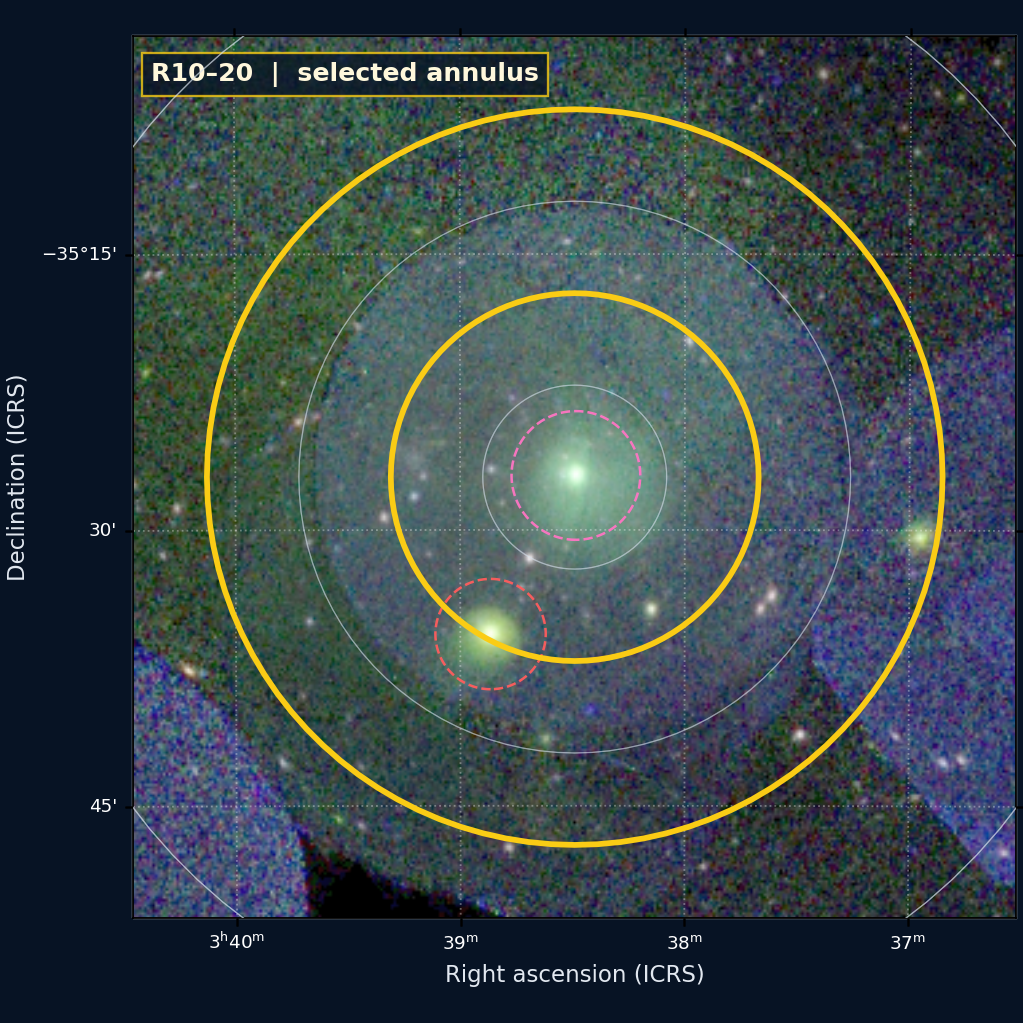
regionR10-20

R10–20

Non-overlapping primary annulus used by the preliminary y calculation.

Corrected scalar-skyarea per-ObsID annular median; displayed spread in the profile is the 16-84% cross-ObsID interval when N>1.
SZ primary
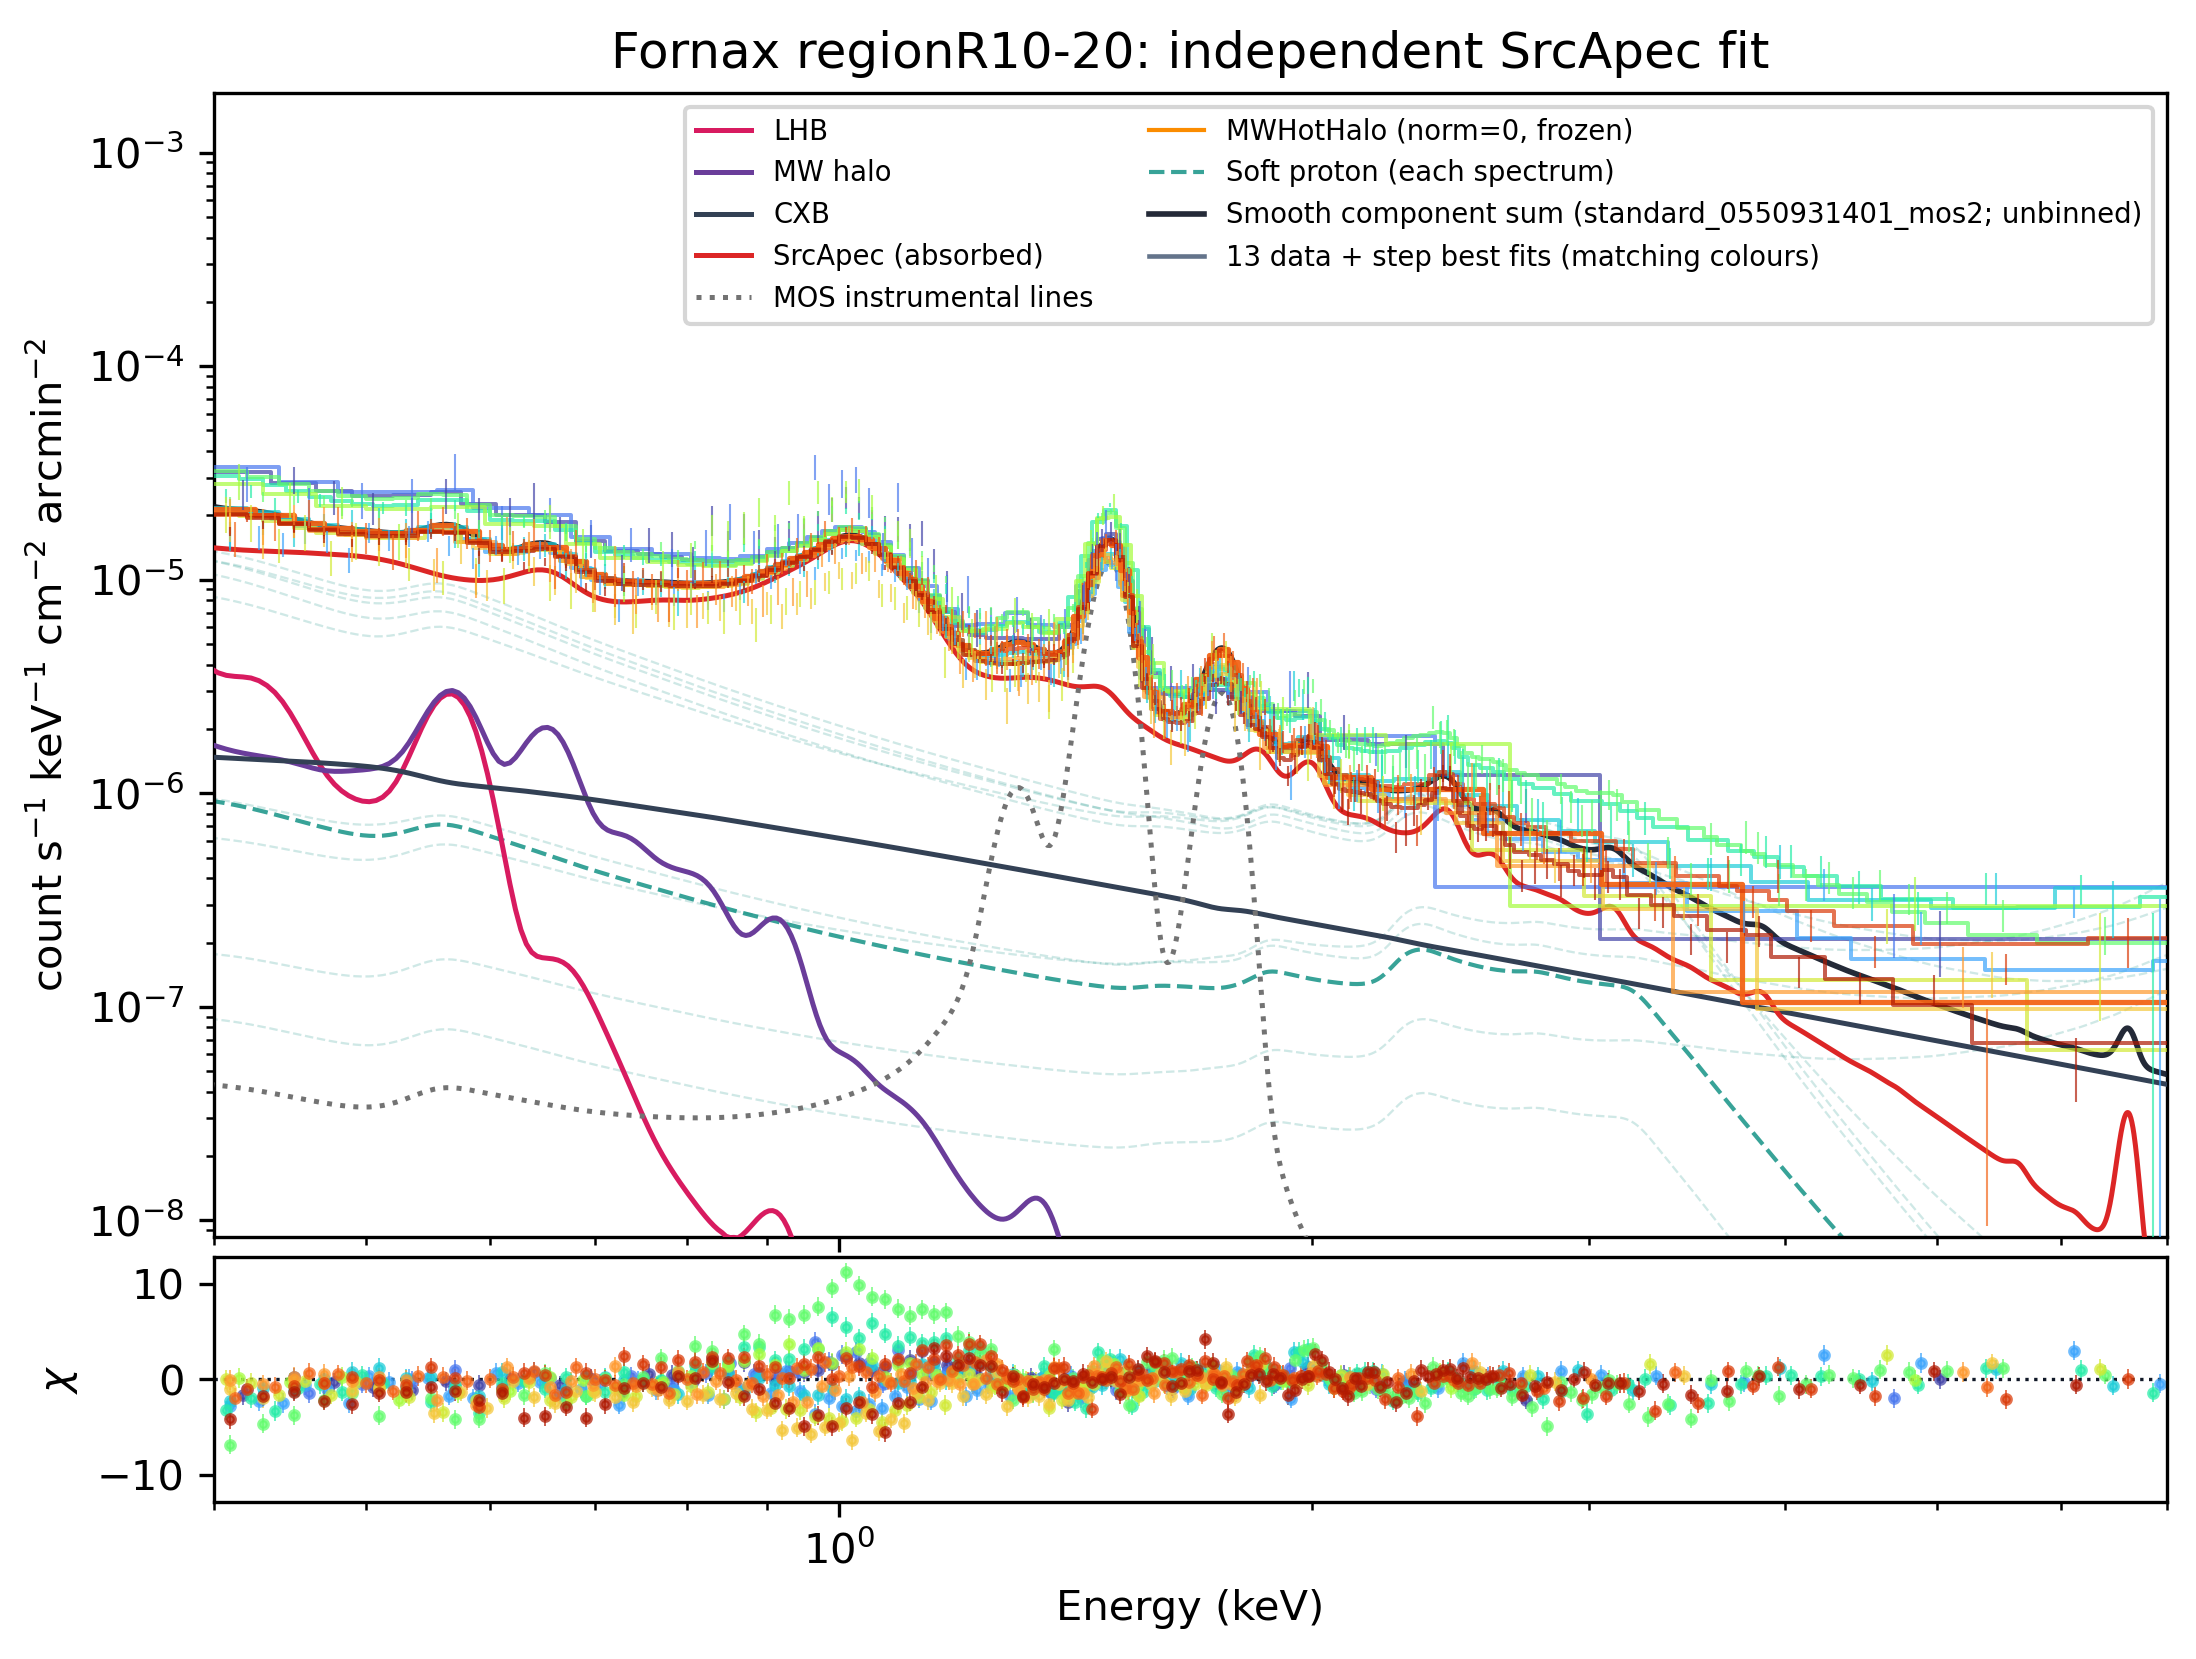
13 MOS spectra7 ObsIDskT 1.370 keVR-stat 0.96norm 2.11e-5 arcmin⁻²
Open region design and best-fit spectrum +
R10–20 on the XMM RGB WCS image
Yellow boundary:R10–20;grey marks other radial designs. Geometry source:reconstructed from config/project_policy.json radial contract; original DS9 file not locally synced。
R10–20 saved best-fit spectrum
The numeric primary-annulus summary is corrected. This legacy grouped spectrum image is retained only for visual diagnostics and is not the corrected model display.
ObsIDs 0012830101 · 0304940101 · 0400620101 · 0550930101 · 0550931001 · 0550931401 · 0781350101

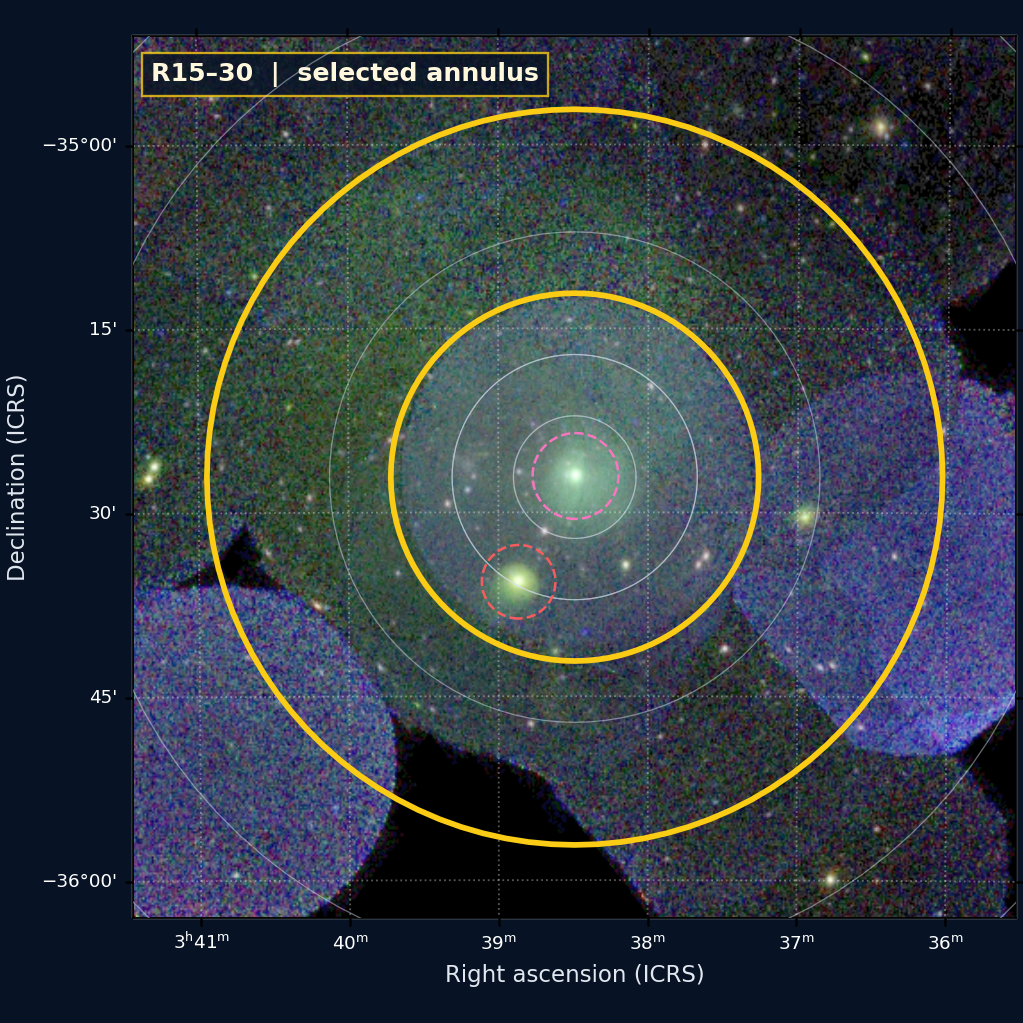
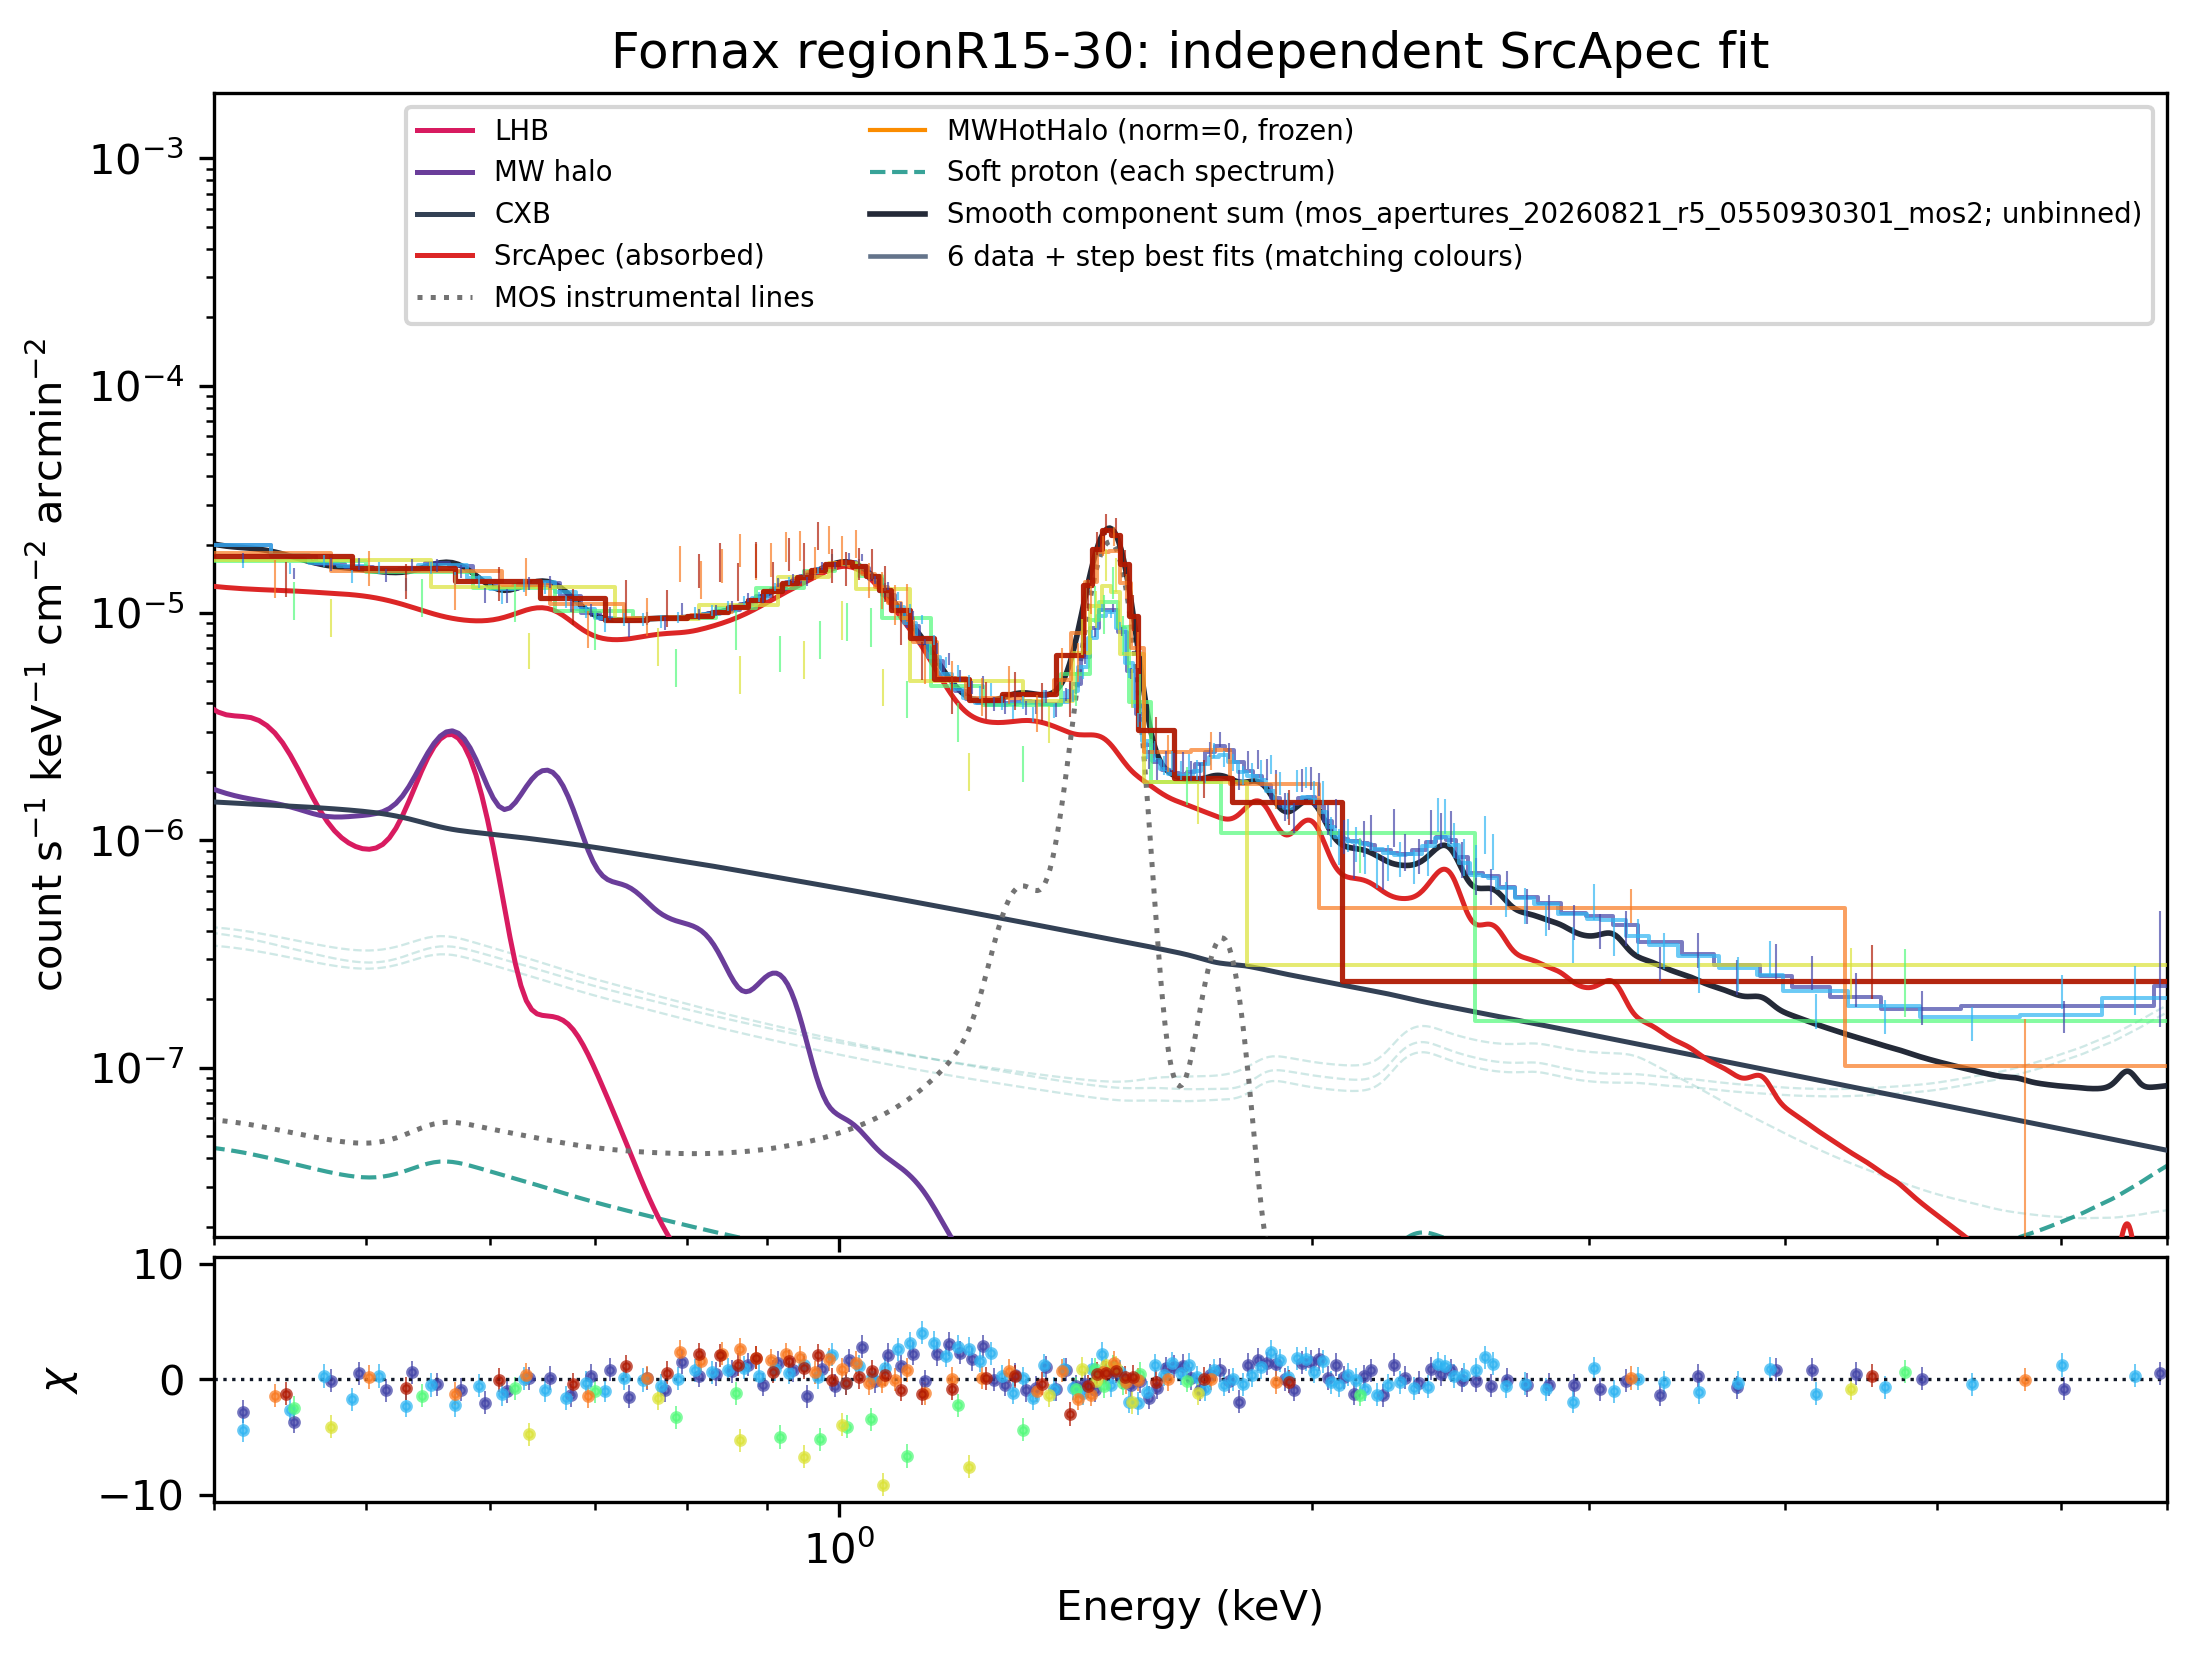
regionR15-30

R15–30

Retained for spectral/profile inspection but not used as an independent y input.

Legacy diagnostic fit (pre scalar-skyarea correction); not used by the current primary profile or y calculation.
Diagnostic overlap
6 MOS spectra3 ObsIDskT 1.261 keVR-stat 3.09norm 3.91e-3 arcmin⁻²
Open region design and best-fit spectrum +
R15–30 on the XMM RGB WCS image
Yellow boundary:R15–30;grey marks other radial designs. Geometry source:region_mos_20260820/regionR15-30.reg。
R15–30 saved best-fit spectrum
Legacy grouped best-fit display retained as a diagnostic; its model normalization predates the scalar-skyarea correction.
ObsIDs 0055140101 · 0140950201 · 0550930301

regionR20-30

R20–30

Non-overlapping primary annulus used by the preliminary y calculation.

Corrected scalar-skyarea per-ObsID annular median; displayed spread in the profile is the 16-84% cross-ObsID interval when N>1.
SZ primary
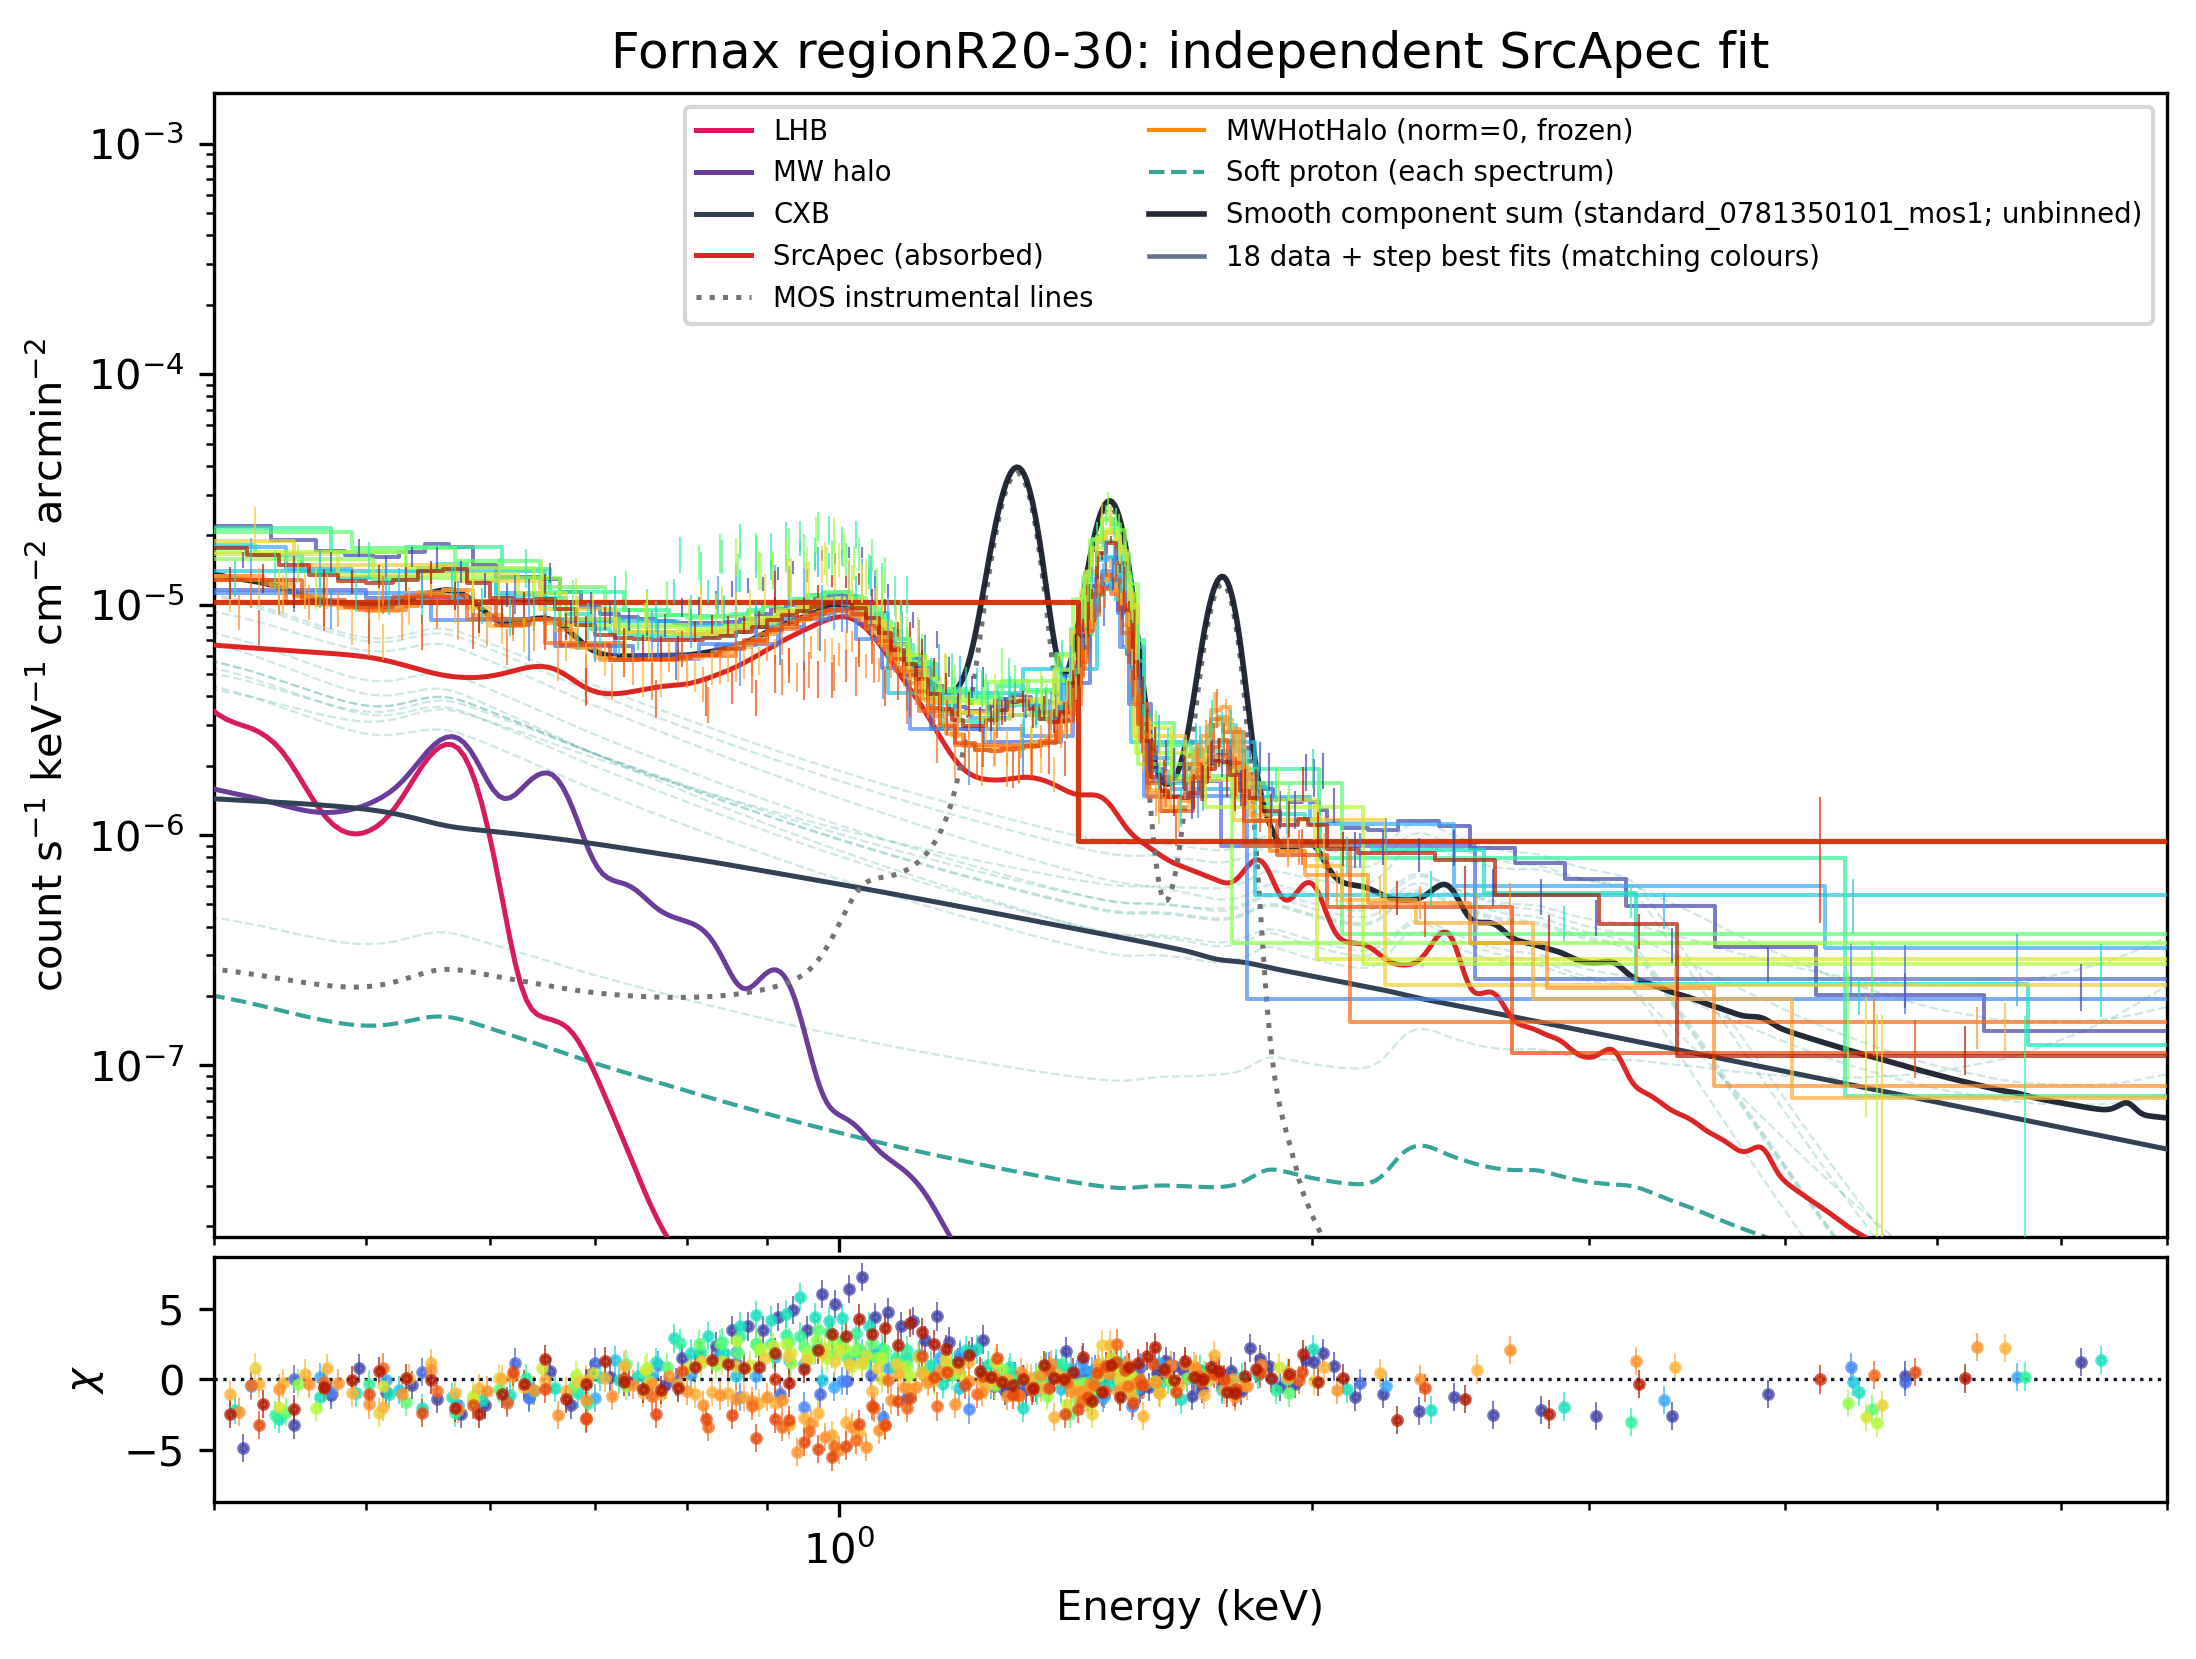
18 MOS spectra10 ObsIDskT 1.198 keVR-stat 0.95norm 1.44e-5 arcmin⁻²
Open region design and best-fit spectrum +
R20–30 on the XMM RGB WCS image
Yellow boundary:R20–30;grey marks other radial designs. Geometry source:reconstructed from config/project_policy.json radial contract; original DS9 file not locally synced。
R20–30 saved best-fit spectrum
The numeric primary-annulus summary is corrected. This legacy grouped spectrum image is retained only for visual diagnostics and is not the corrected model display.
ObsIDs 0055140101 · 0140950201 · 0304940101 · 0550930101 · 0550930301 · 0550930401 · 0550930501 · 0550931001 · 0550931401 · 0781350101

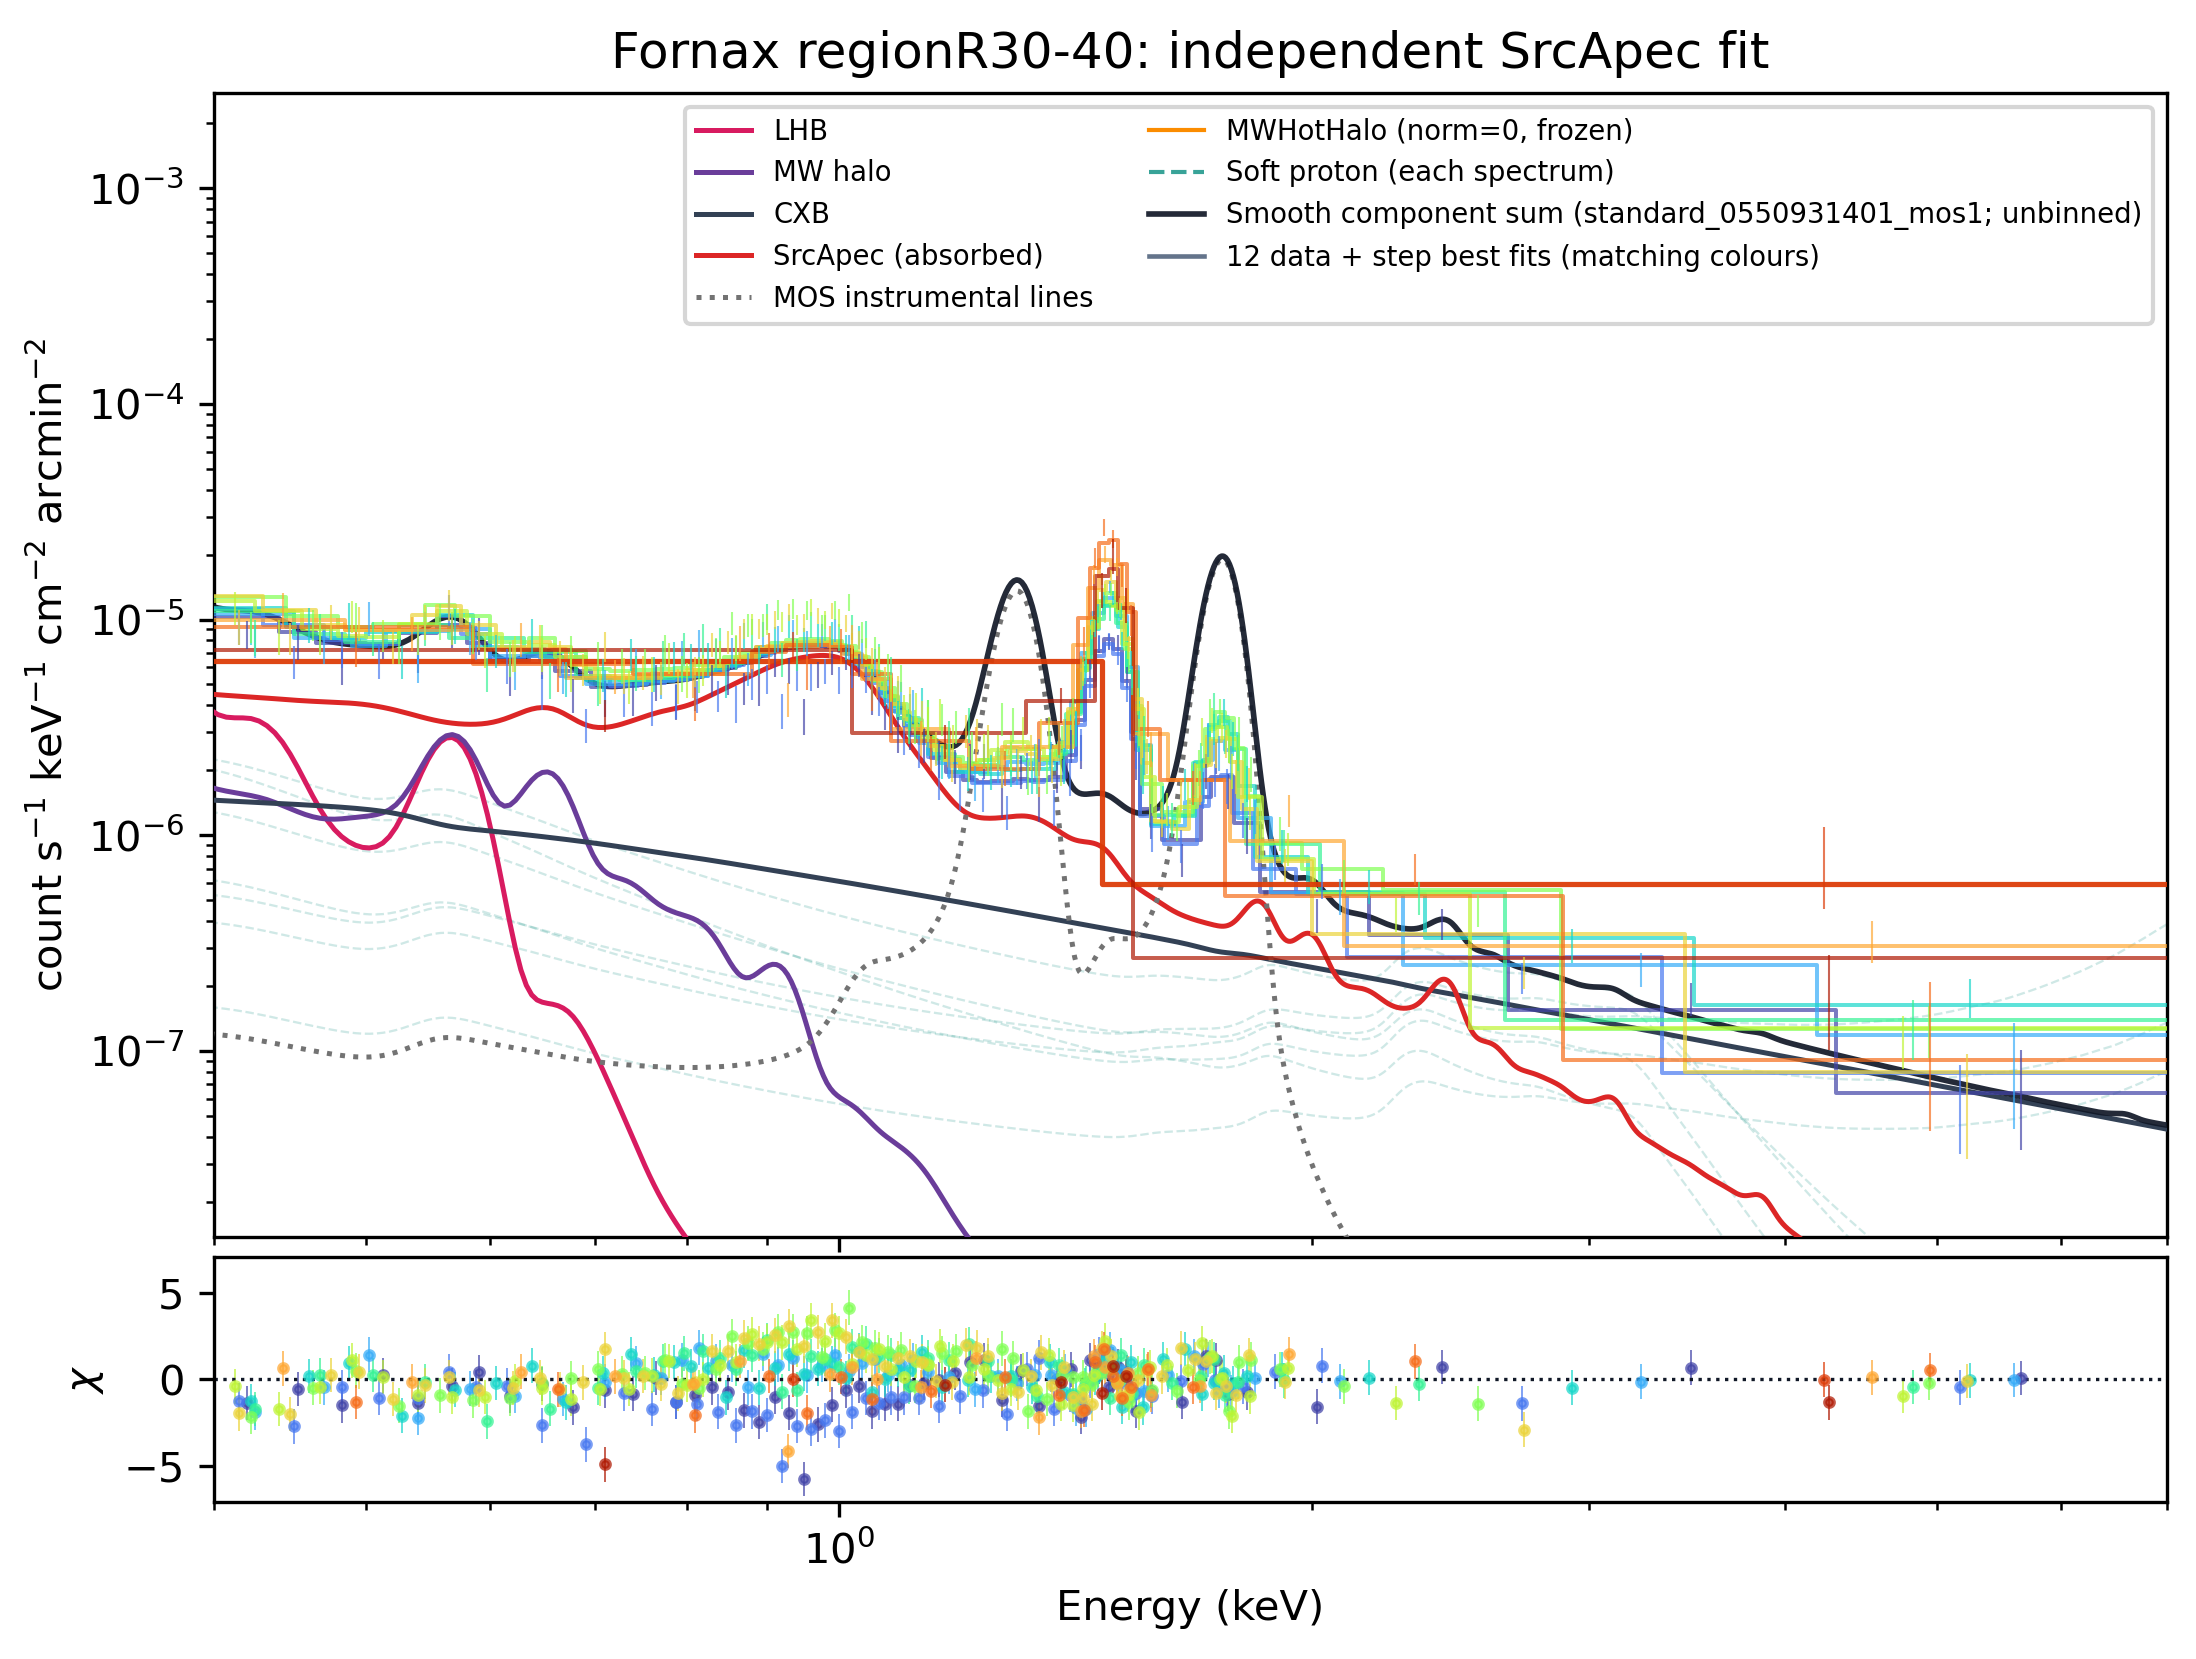
regionR30-40

R30–40

Non-overlapping primary annulus used by the preliminary y calculation.

Corrected scalar-skyarea per-ObsID annular median; displayed spread in the profile is the 16-84% cross-ObsID interval when N>1.
SZ primary
10 MOS spectra5 ObsIDskT 1.089 keVR-stat 1.06norm 7.04e-6 arcmin⁻²
Open region design and best-fit spectrum +
R30–40 on the XMM RGB WCS image
Yellow boundary:R30–40;grey marks other radial designs. Geometry source:reconstructed from config/project_policy.json radial contract; original DS9 file not locally synced。
R30–40 saved best-fit spectrum
The numeric primary-annulus summary is corrected. This legacy grouped spectrum image is retained only for visual diagnostics and is not the corrected model display.
ObsIDs 0140950201 · 0550930301 · 0550930401 · 0550930501 · 0550931001

regionR30-50

R30–50

Retained for spectral/profile inspection but not used as an independent y input.

Legacy diagnostic fit (pre scalar-skyarea correction); not used by the current primary profile or y calculation.
Diagnostic overlap
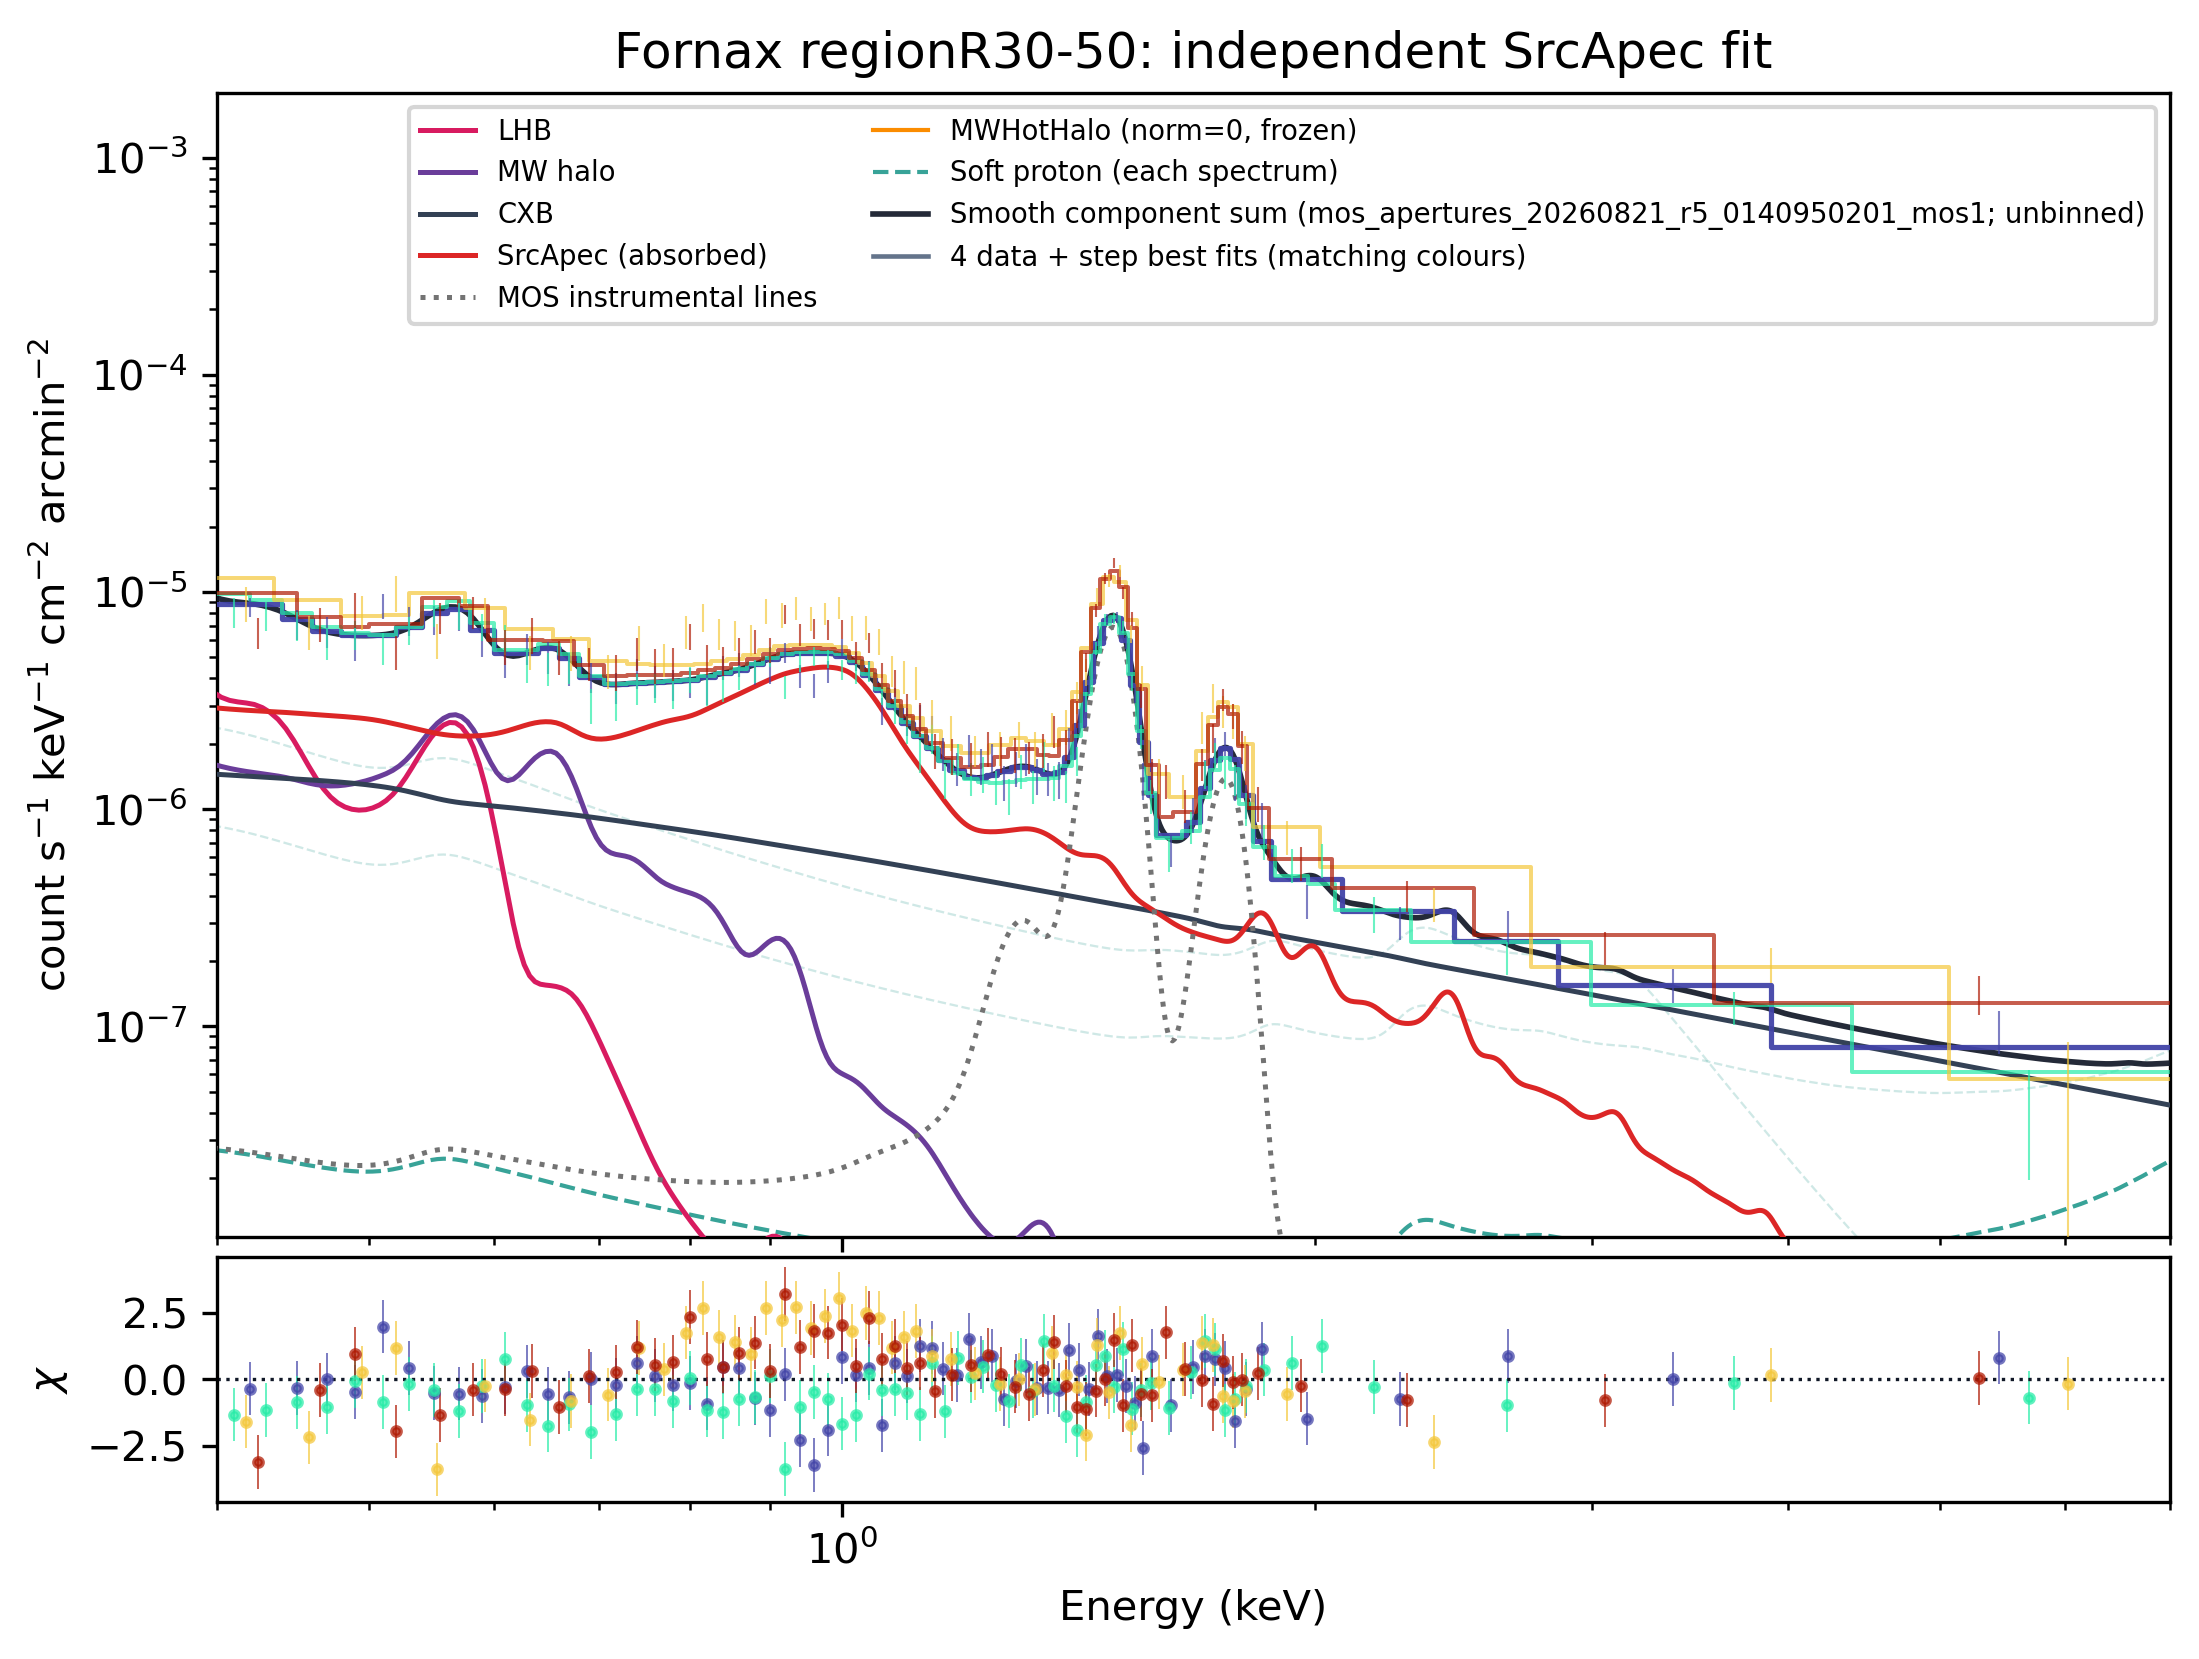
4 MOS spectra2 ObsIDskT 1.098 keVR-stat 1.45norm 8.72e-4 arcmin⁻²
Open region design and best-fit spectrum +
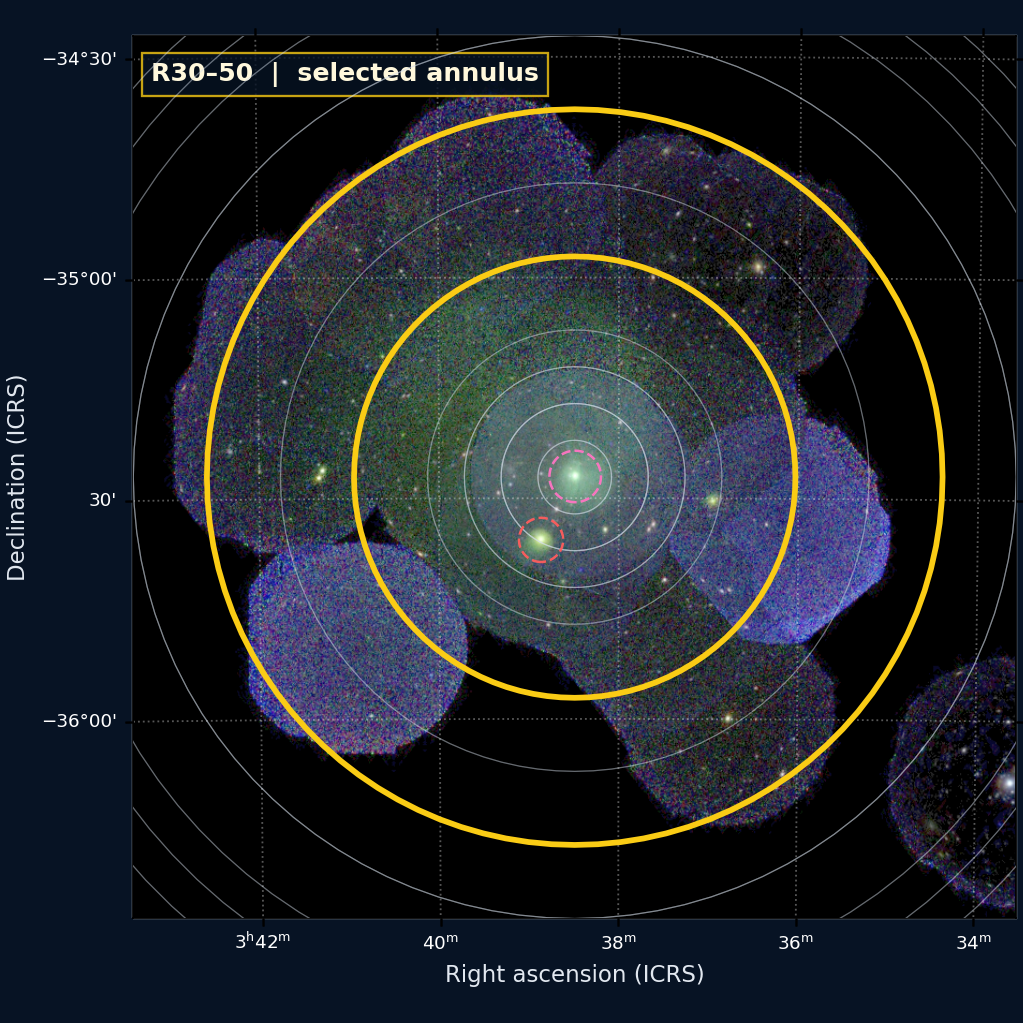
R30–50 on the XMM RGB WCS image
Yellow boundary:R30–50;grey marks other radial designs. Geometry source:region_mos_20260820/regionR30-50.reg。
R30–50 saved best-fit spectrum
Legacy grouped best-fit display retained as a diagnostic; its model normalization predates the scalar-skyarea correction.
ObsIDs 0140950201 · 0550930301

regionR40-50

R40–50

Non-overlapping primary annulus used by the preliminary y calculation.

Corrected scalar-skyarea per-ObsID annular median; displayed spread in the profile is the 16-84% cross-ObsID interval when N>1.
SZ primary
8 MOS spectra4 ObsIDskT 1.032 keVR-stat 1.10norm 3.45e-6 arcmin⁻²
Open region design and best-fit spectrum +
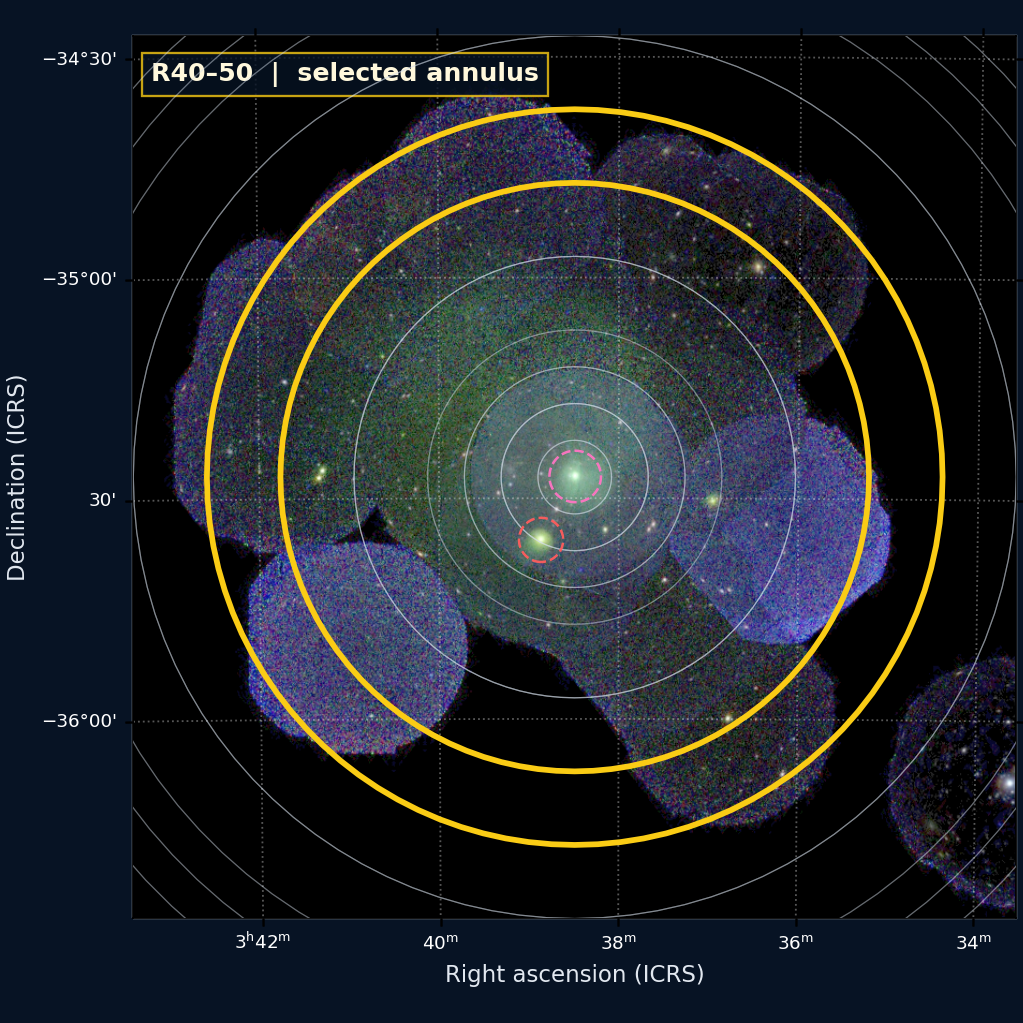
R40–50 on the XMM RGB WCS image
Yellow boundary:R40–50;grey marks other radial designs. Geometry source:reconstructed from config/project_policy.json radial contract; original DS9 file not locally synced。
R40–50 saved best-fit spectrum
The numeric primary-annulus summary is corrected. This legacy grouped spectrum image is retained only for visual diagnostics and is not the corrected model display.
ObsIDs 0140950201 · 0550930301 · 0550930401 · 0550930501

regionR60-70

R60–70

Non-overlapping primary annulus used by the preliminary y calculation.

Corrected scalar-skyarea per-ObsID annular median; displayed spread in the profile is the 16-84% cross-ObsID interval when N>1.
SZ primary
2 MOS spectra1 ObsIDskT 0.999 keVR-stat 1.10norm 1.12e-6 arcmin⁻²
Open region design and best-fit spectrum +
R60–70 on the XMM RGB WCS image
Yellow boundary:R60–70;grey marks other radial designs. Geometry source:region_mos_outer_split_20260821/regionR60-70.reg。
R60–70 saved best-fit spectrum
The numeric primary-annulus summary is corrected. This legacy grouped spectrum image is retained only for visual diagnostics and is not the corrected model display.
ObsIDs 0205590301

regionR60-75

R60–75

Retained for spectral/profile inspection but not used as an independent y input.

Legacy diagnostic fit (pre scalar-skyarea correction); not used by the current primary profile or y calculation.
Diagnostic overlap
2 MOS spectra1 ObsIDskT 0.948 keVR-stat 1.62norm 2.11e-4 arcmin⁻²
Open region design and best-fit spectrum +
R60–75 on the XMM RGB WCS image
Yellow boundary:R60–75;grey marks other radial designs. Geometry source:region_mos_outer_split_20260821/regionR60-75.reg。
R60–75 saved best-fit spectrum
Legacy grouped best-fit display retained as a diagnostic; its model normalization predates the scalar-skyarea correction.
ObsIDs 0205590301

regionR60-90

R60–90

Retained for spectral/profile inspection but not used as an independent y input.

Legacy diagnostic fit (pre scalar-skyarea correction); not used by the current primary profile or y calculation.
Diagnostic overlap
24 MOS spectra12 ObsIDskT 0.993 keVR-stat 1.70norm 1.75e-4 arcmin⁻²
Open region design and best-fit spectrum +
R60–90 on the XMM RGB WCS image
Yellow boundary:R60–90;grey marks other radial designs. Geometry source:reconstructed from config/project_policy.json radial contract; original DS9 file not locally synced。
R60–90 saved best-fit spectrum
Legacy grouped best-fit display retained as a diagnostic; its model normalization predates the scalar-skyarea correction.
ObsIDs 0151370101 · 0151370701 · 0205590301 · 0505140201 · 0505140401 · 0505140501 · 0692840201 · 0692840301 · 0692840401 · 0692840501 · 0924160101 · 0924160201

regionR70-80

R70–80

Non-overlapping primary annulus used by the preliminary y calculation.

Corrected scalar-skyarea per-ObsID annular median; displayed spread in the profile is the 16-84% cross-ObsID interval when N>1.
SZ primary
2 MOS spectra1 ObsIDskT 0.856 keVR-stat 1.43norm 6.01e-7 arcmin⁻²
Open region design and best-fit spectrum +
R70–80 on the XMM RGB WCS image
Yellow boundary:R70–80;grey marks other radial designs. Geometry source:region_mos_outer_split_20260821/regionR70-80.reg。
R70–80 saved best-fit spectrum
The numeric primary-annulus summary is corrected. This legacy grouped spectrum image is retained only for visual diagnostics and is not the corrected model display.
ObsIDs 0205590301

regionR75-90

R75–90

Retained for spectral/profile inspection but not used as an independent y input.

Legacy diagnostic fit (pre scalar-skyarea correction); not used by the current primary profile or y calculation.
Diagnostic overlap
2 MOS spectra1 ObsIDskT 0.898 keVR-stat 1.24norm 1.07e-4 arcmin⁻²
Open region design and best-fit spectrum +
R75–90 on the XMM RGB WCS image
Yellow boundary:R75–90;grey marks other radial designs. Geometry source:region_mos_outer_split_20260821/regionR75-90.reg。
R75–90 saved best-fit spectrum
Legacy grouped best-fit display retained as a diagnostic; its model normalization predates the scalar-skyarea correction.
ObsIDs 0205590301

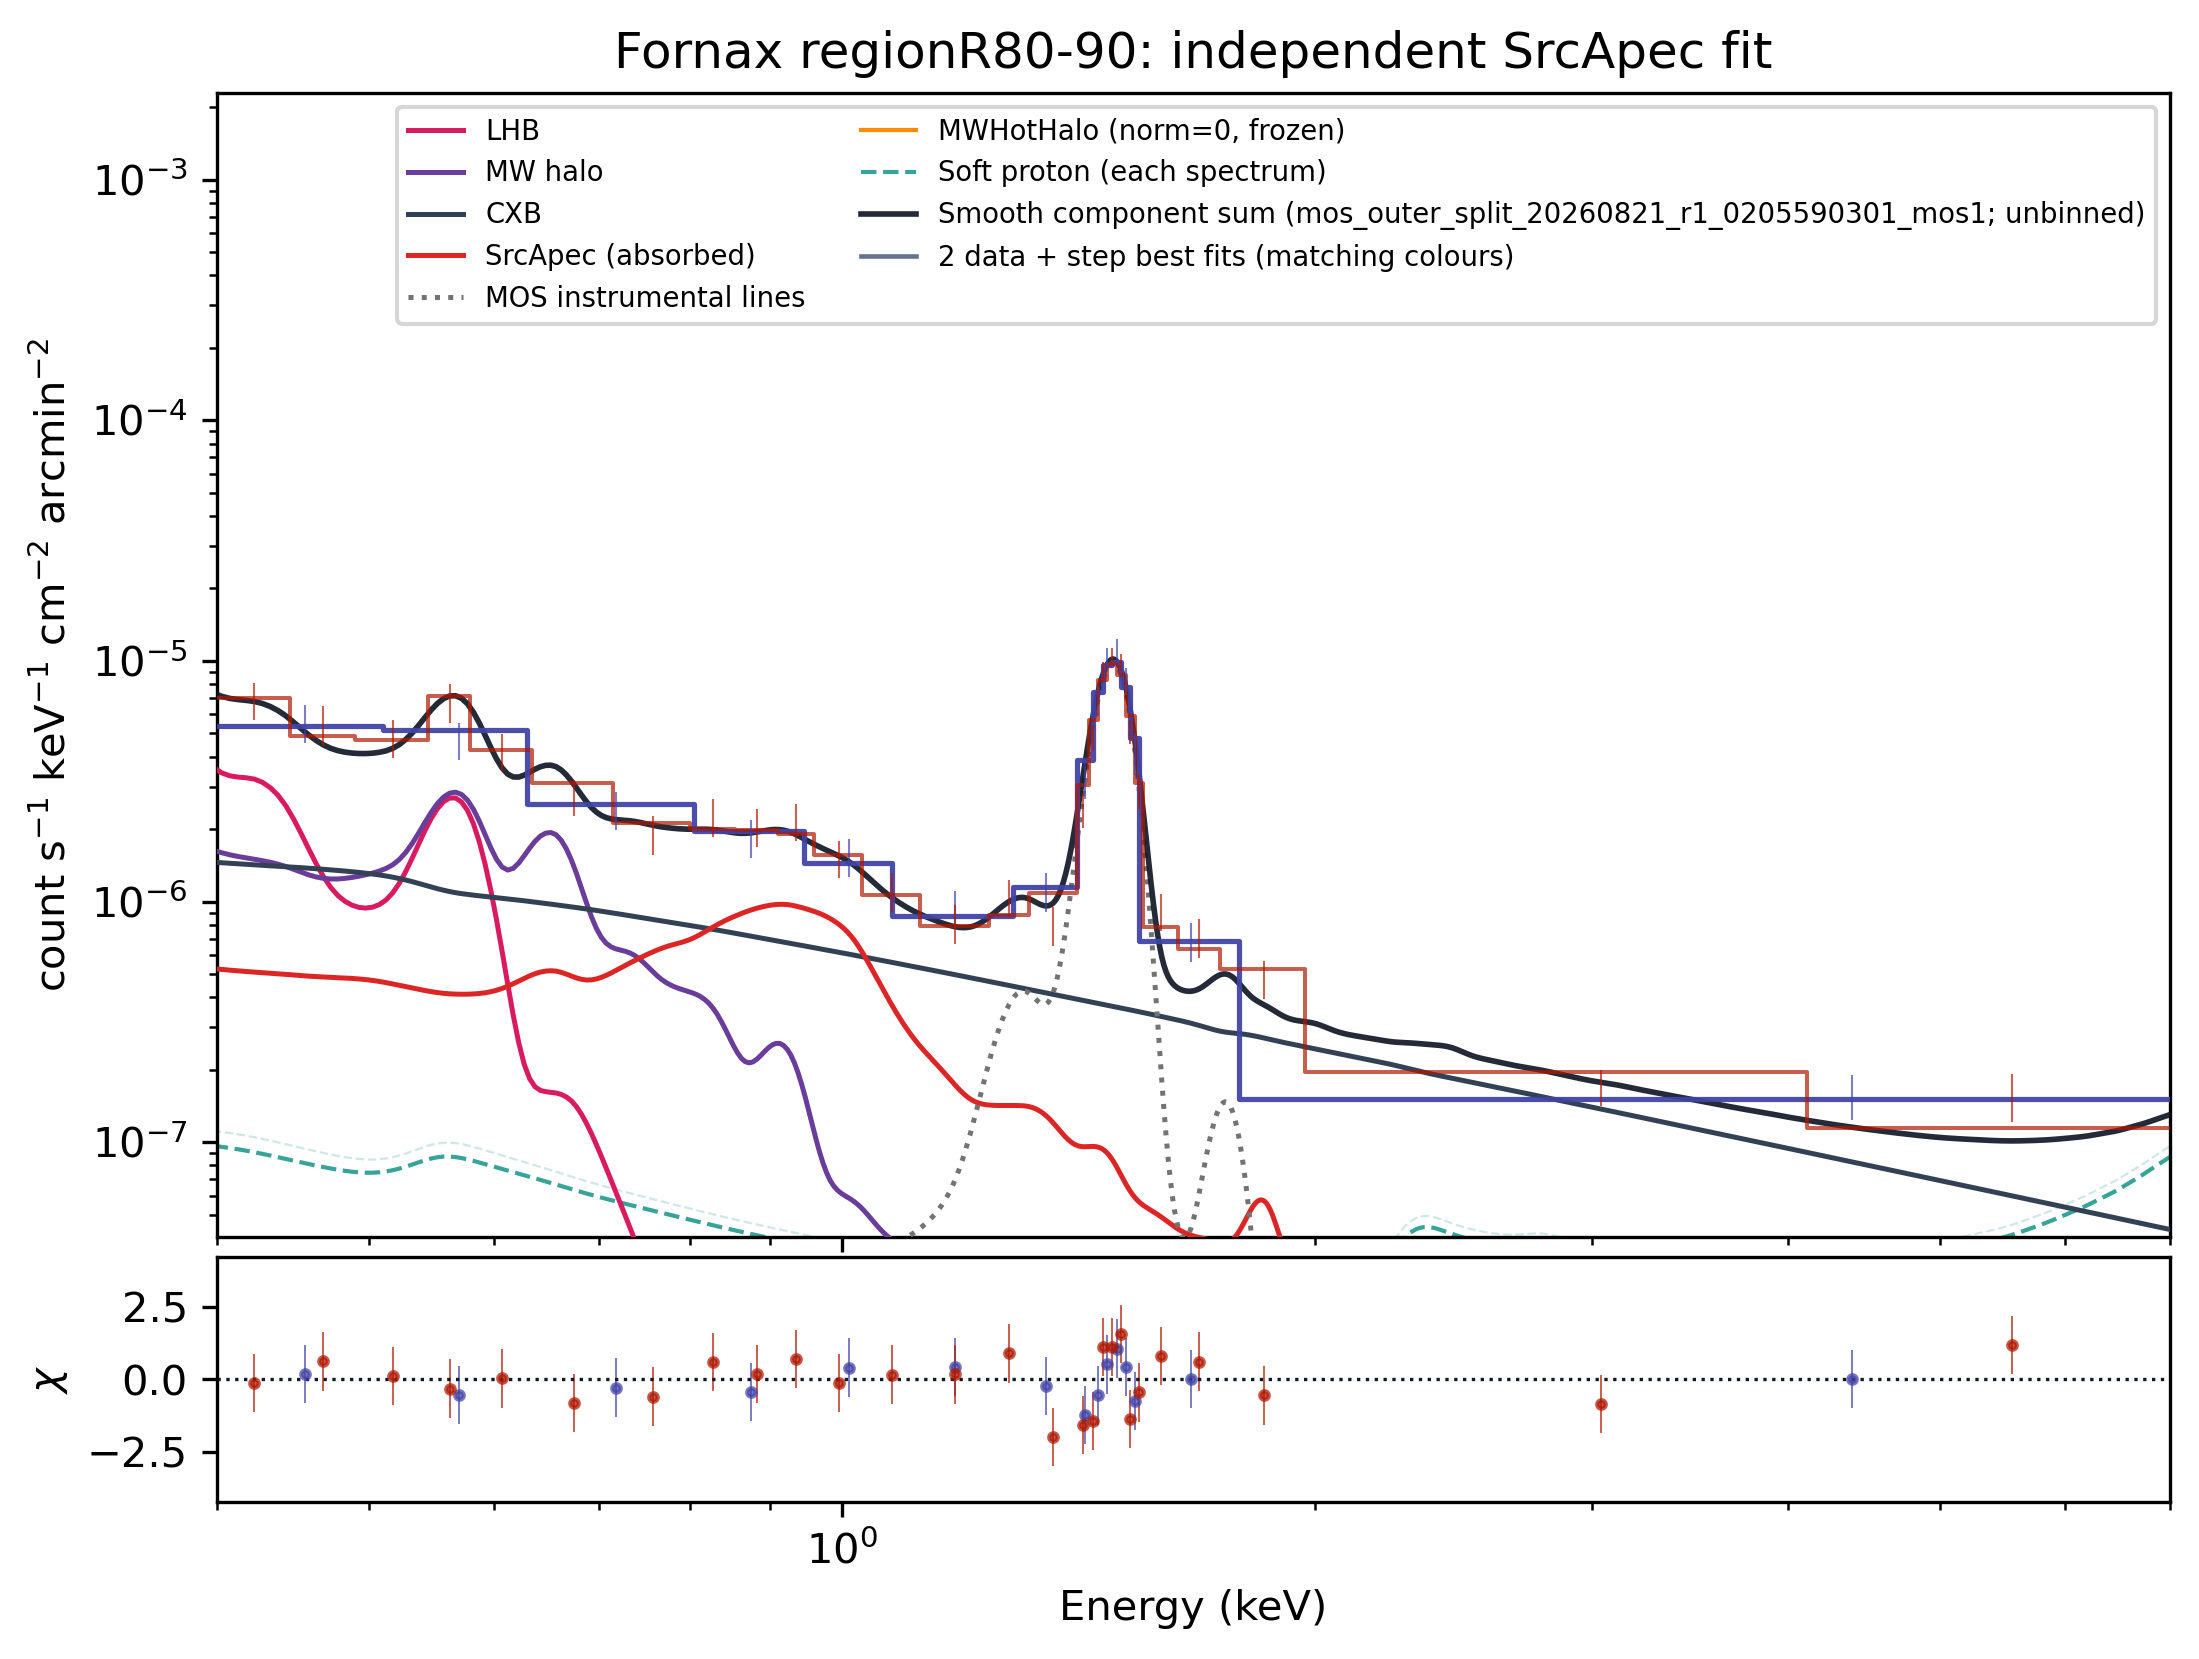
regionR80-90

R80–90

Non-overlapping primary annulus used by the preliminary y calculation.

Corrected scalar-skyarea per-ObsID annular median; displayed spread in the profile is the 16-84% cross-ObsID interval when N>1.
SZ primary
2 MOS spectra1 ObsIDskT 0.970 keVR-stat 0.97norm 7.51e-7 arcmin⁻²
Open region design and best-fit spectrum +
R80–90 on the XMM RGB WCS image
Yellow boundary:R80–90;grey marks other radial designs. Geometry source:region_mos_outer_split_20260821/regionR80-90.reg。
R80–90 saved best-fit spectrum
The numeric primary-annulus summary is corrected. This legacy grouped spectrum image is retained only for visual diagnostics and is not the corrected model display.
ObsIDs 0205590301